PNC Bank 2005 Annual Report Download - page 44
Download and view the complete annual report
Please find page 44 of the 2005 PNC Bank annual report below. You can navigate through the pages in the report by either clicking on the pages listed below, or by using the keyword search tool below to find specific information within the annual report.-
 1
1 -
2
-
3
-
4
-
5
-
6
-
7
-
8
-
9
-
10
-
11
-
12
-
13
-
14
-
15
-
16
-
17
-
18
-
19
-
20
-
21
-
22
-
23
-
24
-
25
-
26
-
27
-
28
-
29
-
30
-
31
-
32
-
33
-
 34
34 -
 35
35 -
 36
36 -
 37
37 -
 38
38 -
 39
39 -
 40
40 -
 41
41 -
 42
42 -
 43
43 -
 44
44 -
 45
45 -
 46
46 -
 47
47 -
 48
48 -
 49
49 -
 50
50 -
 51
51 -
 52
52 -
 53
53 -
 54
54 -
55
-
56
-
57
-
58
-
59
-
60
-
61
-
62
-
63
-
64
-
65
-
66
-
67
-
68
-
69
-
70
-
71
-
72
-
73
-
74
-
75
-
76
-
77
-
78
-
79
-
80
-
81
-
82
-
83
-
84
-
85
-
86
-
87
-
88
-
89
-
90
-
91
-
92
-
93
-
94
-
95
-
96
-
97
-
98
-
99
-
100
-
101
-
102
-
103
-
104
-
105
-
106
-
107
-
108
-
109
-
110
-
111
-
112
-
113
-
114
-
115
-
116
-
117
-
118
-
119
-
120
-
121
-
122
-
123
-
124
-
125
-
126
-
127
-
128
-
129
-
130
-
131
-
132
-
133
-
134
-
135
-
136
-
137
-
138
-
139
-
140
-
141
-
142
-
143
-
144
-
145
-
146
-
147
-
148
-
149
-
150
-
151
-
152
-
153
-
154
-
155
-
156
-
157
-
158
-
159
-
160
-
161
-
162
-
163
-
164
-
165
-
166
-
167
-
168
-
169
-
170
-
171
-
172
-
173
-
174
-
175
-
176
-
177
-
178
-
179
-
180
-
181
-
182
-
183
-
184
-
185
-
186
-
187
-
188
-
189
-
190
-
191
-
192
-
193
-
194
-
195
-
196
-
197
-
198
-
199
-
200
-
201
-
202
-
203
-
204
-
205
-
206
-
207
-
208
-
209
-
210
-
211
-
212
-
213
-
214
-
215
-
216
-
217
-
218
-
219
-
220
-
221
-
222
-
223
-
224
-
225
-
226
-
227
-
228
-
229
-
230
-
231
-
232
-
233
-
234
-
235
-
236
-
237
-
238
-
239
-
240
-
241
-
242
-
243
-
244
-
245
-
246
-
247
-
248
-
249
-
250
-
251
-
252
-
253
-
254
-
255
-
256
-
257
-
258
-
259
-
260
-
261
-
262
-
263
-
264
-
265
-
266
-
267
-
268
-
269
-
270
-
271
-
272
-
273
-
274
-
275
-
276
-
277
-
278
-
279
-
280
-
281
-
282
-
283
-
284
-
285
-
286
-
287
-
288
-
289
-
290
-
291
-
292
-
293
-
294
-
295
-
296
-
297
-
298
-
299
-
300
 |
 |

44
STATUS OF DEFINED BENEFIT
PENSION PLAN
We have a noncontributory, qualified defined benefit
pension plan ("plan" or "pension plan") covering eligible
employees. Retirement benefits are derived from a cash
balance formula based on compensation levels, age and
length of service. Pension contributions are based on an
actuarially determined amount necessary to fund total
benefits payable to plan participants. Plan assets are
currently approximately 60% invested in equity investments
with most of the remainder invested in fixed income
instruments. Plan fiduciaries determine and review the
plan’ s investment policy.
We calculate the expense associated with the pension plan
in accordance with SFAS 87, "Employers' Accounting for
Pensions," and we use assumptions and methods that are
compatible with the requirements of SFAS 87, including a
policy of reflecting trust assets at their fair market value. On
an annual basis, we review the actuarial assumptions related
to the pension plan, including the discount rate, rate of
compensation increase and the expected return on plan
assets. Neither the discount rate nor the compensation
increase assumptions significantly affect pension expense.
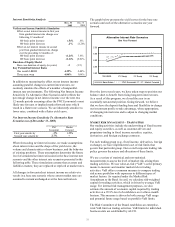
The expected long-term return on assets assumption does
significantly affect pension expense. We intend to decrease
the expected long-term return on plan assets assumption
from the 8.5% used for 2005 to 8.25% for determining net
periodic cost for 2006. Also, under current accounting rules,
the difference between expected long-term returns and
actual returns are accumulated and amortized to pension
expense over future periods. Each one percentage point
difference in actual return compared with our expected
return causes expense in the following year to change by up
to $3 million.
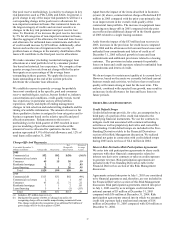
The table below reflects the estimated effects on pension
expense of certain changes in assumptions, using 2006
estimated expense as a baseline.
Change in Assumption
Estimated
Increase to 2006
Pension
Expense
(In millions)
.5% decrease in discount rate $2
.5% decrease in expected long-term return
on assets
8
.5% increase in compensation rate 1
We currently estimate a pretax pension benefit of $1 million
in 2006 compared with a pretax benefit of $8 million in
2005.
In accordance with SFAS 87 and SFAS 132 (Revised 2003),
"Employers' Disclosures about Pensions and Other
Postretirement Benefits," we may have to eliminate any
prepaid pension asset and recognize a minimum pension
liability if the accumulated benefit obligation exceeds the
fair value of plan assets at year-end. We would recognize
the corresponding charge as a component of other
comprehensive income and it would reduce total
shareholders' equity, but it would not affect net income. At
December 31, 2005, the fair value of plan assets was $1.627
billion, which exceeded the accumulated benefit obligation
of $1.232 billion. The status at year-end 2006 will depend
primarily upon 2006 investment returns and the level of
contributions, if any, we make to the plan during 2006.
Plan asset investment performance has the most impact on
contribution requirements. However, contribution
requirements are not particularly sensitive to actuarial
assumptions. Investment performance will drive the amount
of permitted contributions in future years. Also, current law
sets limits as to both minimum and maximum contributions
to the plan. In any event, any large near-term contributions
to the plan will be at our discretion, as we expect that the
minimum required contributions under the law will be
minimal or zero for several years.
During the second quarter of 2005, we acquired a frozen
defined benefit pension plan as a result of the Riggs
acquisition. Plan assets and projected benefit obligations of
the Riggs plan were approximately $107 million and $116
million, respectively, at acquisition date. The $9 million
funding deficit was recognized as part of the Riggs
acquisition purchase price allocation. For determining
contribution amounts to the plan, deficits are calculated
using ERISA-mandated rules, and on this basis we
contributed approximately $16 million to the Riggs plan
during the third quarter of 2005. We integrated the Riggs
plan into the PNC plan on December 30, 2005.
We maintain other defined benefit plans that have a less
significant effect on financial results, including various
nonqualified supplemental retirement plans for certain
employees. See Note 17 Employee Benefit Plans in the
Notes To Consolidated Financial Statements in Item 8 of
this Report for additional information.
RISK MANAGEMENT
We encounter risk as part of the normal course of our
business and we design risk management processes to help
manage these risks. This Risk Management section first
provides an overview of the risk measurement, control
strategies, and monitoring aspects of our corporate-level risk
management processes. Following that discussion is an
analysis of the risk management process for what we view
as our primary areas of risk: credit, operational, liquidity,
and market. The discussion of market risk is further
subdivided into interest rate, trading, and equity and other
investment risk areas. Our use of financial derivatives as
part of our overall asset and liability risk management
process is also addressed within the Risk Management
section of this Item 7. In appropriate places within this
section, historical performance is also addressed.
OVERVIEW
As a financial services organization, we take a certain
amount of risk in every business decision. For example,
every time we open an account or approve a loan for a
customer, process a payment, hire a new employee, or
implement a new computer system, we incur a certain
amount of risk. As an organization, we must balance
revenue generation and profitability with the risks
associated with our business activities. Risk management is
not about eliminating risks, but about identifying and
accepting risks and then effectively managing them so to
optimize shareholder value.