PNC Bank 2005 Annual Report Download - page 52
Download and view the complete annual report
Please find page 52 of the 2005 PNC Bank annual report below. You can navigate through the pages in the report by either clicking on the pages listed below, or by using the keyword search tool below to find specific information within the annual report.-
 1
1 -
2
-
3
-
4
-
5
-
6
-
7
-
8
-
9
-
10
-
11
-
12
-
13
-
14
-
15
-
16
-
17
-
18
-
19
-
20
-
21
-
22
-
23
-
24
-
25
-
26
-
27
-
28
-
29
-
30
-
31
-
32
-
33
-
34
-
35
-
36
-
37
-
38
-
39
-
40
-
41
-
 42
42 -
 43
43 -
 44
44 -
 45
45 -
 46
46 -
 47
47 -
 48
48 -
 49
49 -
 50
50 -
 51
51 -
 52
52 -
 53
53 -
 54
54 -
 55
55 -
 56
56 -
 57
57 -
 58
58 -
 59
59 -
 60
60 -
 61
61 -
 62
62 -
63
-
64
-
65
-
66
-
67
-
68
-
69
-
70
-
71
-
72
-
73
-
74
-
75
-
76
-
77
-
78
-
79
-
80
-
81
-
82
-
83
-
84
-
85
-
86
-
87
-
88
-
89
-
90
-
91
-
92
-
93
-
94
-
95
-
96
-
97
-
98
-
99
-
100
-
101
-
102
-
103
-
104
-
105
-
106
-
107
-
108
-
109
-
110
-
111
-
112
-
113
-
114
-
115
-
116
-
117
-
118
-
119
-
120
-
121
-
122
-
123
-
124
-
125
-
126
-
127
-
128
-
129
-
130
-
131
-
132
-
133
-
134
-
135
-
136
-
137
-
138
-
139
-
140
-
141
-
142
-
143
-
144
-
145
-
146
-
147
-
148
-
149
-
150
-
151
-
152
-
153
-
154
-
155
-
156
-
157
-
158
-
159
-
160
-
161
-
162
-
163
-
164
-
165
-
166
-
167
-
168
-
169
-
170
-
171
-
172
-
173
-
174
-
175
-
176
-
177
-
178
-
179
-
180
-
181
-
182
-
183
-
184
-
185
-
186
-
187
-
188
-
189
-
190
-
191
-
192
-
193
-
194
-
195
-
196
-
197
-
198
-
199
-
200
-
201
-
202
-
203
-
204
-
205
-
206
-
207
-
208
-
209
-
210
-
211
-
212
-
213
-
214
-
215
-
216
-
217
-
218
-
219
-
220
-
221
-
222
-
223
-
224
-
225
-
226
-
227
-
228
-
229
-
230
-
231
-
232
-
233
-
234
-
235
-
236
-
237
-
238
-
239
-
240
-
241
-
242
-
243
-
244
-
245
-
246
-
247
-
248
-
249
-
250
-
251
-
252
-
253
-
254
-
255
-
256
-
257
-
258
-
259
-
260
-
261
-
262
-
263
-
264
-
265
-
266
-
267
-
268
-
269
-
270
-
271
-
272
-
273
-
274
-
275
-
276
-
277
-
278
-
279
-
280
-
281
-
282
-
283
-
284
-
285
-
286
-
287
-
288
-
289
-
290
-
291
-
292
-
293
-
294
-
295
-
296
-
297
-
298
-
299
-
300
 |
 |
52
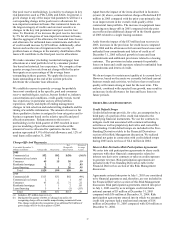
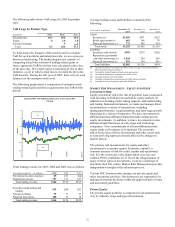
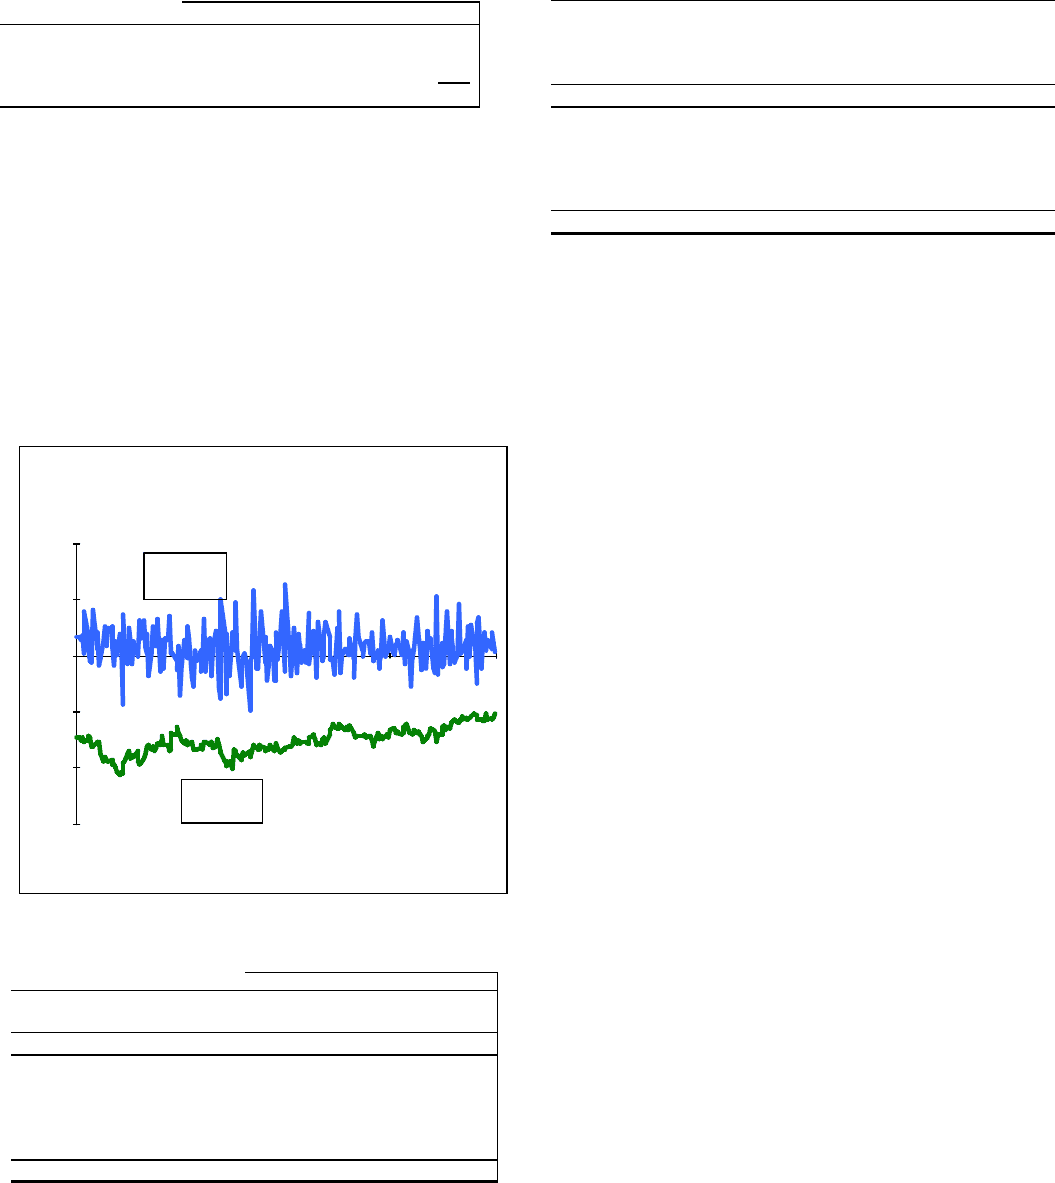
The following table shows VaR usage for 2005 by product
type:
VaR Usage by Product Type
In millions Min. Max. Avg.
Fixed Income $4.1 $9.4 $6.4
Equity .6 1.8 1.0
Foreign Exchange .5
.2
Total 5.1 10.6 $7.6
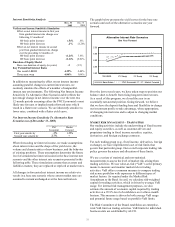
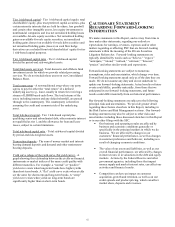
To help ensure the integrity of the models used to calculate
VaR for each portfolio and enterprise-wide, we use a process
known as backtesting. The backtesting process consists of
comparing actual observations of trading-related gains or
losses against the VaR levels that were calculated at the close
of the prior day. We would expect a maximum of two to three
instances a year in which actual losses exceeded the prior day
VaR measure. During the full year of 2005, there were no such
instances at the enterprise-wide level.
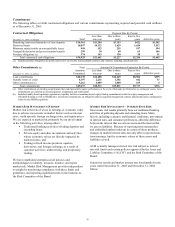
The following graph shows a comparison of enterprise-wide
trading-related gains and losses against prior day VaR for the
period.
Enterprise-Wide Trading-Related Gains/Losses Versus Value at Risk
YTD 2005
(15)
(10)
(5)
0
5
10
12/31/2004
3/31/2005
6/30/2005
9/30/2005
12/31/2005
Millions
VaR
P&L
Total trading revenue for 2005, 2004 and 2003 was as follows:
Year end December 31 – in millions 2005 2004 2003
Net interest income (expense) $9 $13 $(2)
Noninterest income 157 113 127
Total trading revenue $166 $126 $125
Securities underwriting and
trading $19 $60 $82
Foreign exchange 39 31 25
Financial derivatives 108 35 18
Total trading revenue $166 $126 $125
Average trading assets and liabilities consisted of the
following:
Year ended - in millions December 31
2005
December 31
2004
December 31
2003
Assets
Securities (a) $1,850 $871 $152
Resale agr eements (b) 663 166 70
Financial derivatives (c) 772 605 914
Total assets $3,285 $1,642 $1,136
Liabilities
Securities sold short (d) $993 $275 $120
Repurchase agreements
and other borrowings (e)
1,044 249 249
Financial derivatives (f) 825 594 545
Total liabilities $2,862 $1,118 $914
(a) Included in Interest-earning assets-Other on the Average Consolidated Balance
Sheet And Net Interest Analysis.
(b) Included in Federal funds sold and resale agreements.
(c) Included in Noninterest-earning assets-Other assets.
(d) Included in Other borrowed funds.
(e) Included in Repurchase agreements and Other borrowed funds.
(f) Included in Accrued expenses and other liabilities.
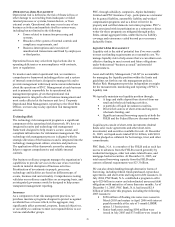
MARKET RISK MANAGEMENT – EQUITY AND OTHER
INVESTMENT RISK
Equity investment risk is the risk of potential losses associated
with investing in both private and public equity markets. In
addition to extending credit, taking deposits, and underwriting
and trading financial instruments, we make and manage direct
investments in a variety of transactions, including
management buyouts, recapitalizations, and later-stage growth
financings in a variety of industries. We have investments in
affiliated and non-affiliated funds that make similar private
equity investments. In addition, we have investments in non-
affiliated funds that invest in early stage and technology
companies. New commitments to all non-affiliated private
equity funds will continue to be minimal. The economic
and/or book value of these investments and other assets such
as loan servicing rights are directly affected by changes in
market factors.
The primary risk measurement for equity and other
investments is economic capital. Economic capital is a
common measure of risk for credit, market and operational
risk. It is the worst-case value depreciation over one year
within a 99.9% confidence level. Given the illiquid nature of
many of these types of investments, it can be a challenge to
determine their fair values. Market Risk Management provides
independent oversight of the valuation process.
Various PNC business units manage our private equity and
other investment activities. Our businesses are responsible for
making investment decisions within the approved policy limits
and associated guidelines.
Private Equity
The private equity portfolio is comprised of investments that
vary by industry, stage and type of investment.