PNC Bank 2005 Annual Report Download - page 29
Download and view the complete annual report
Please find page 29 of the 2005 PNC Bank annual report below. You can navigate through the pages in the report by either clicking on the pages listed below, or by using the keyword search tool below to find specific information within the annual report.-
 1
1 -
2
-
3
-
4
-
5
-
6
-
7
-
8
-
9
-
10
-
11
-
12
-
13
-
14
-
15
-
16
-
17
-
18
-
 19
19 -
 20
20 -
 21
21 -
 22
22 -
 23
23 -
 24
24 -
 25
25 -
 26
26 -
 27
27 -
 28
28 -
 29
29 -
 30
30 -
 31
31 -
 32
32 -
 33
33 -
 34
34 -
 35
35 -
 36
36 -
 37
37 -
 38
38 -
 39
39 -
40
-
41
-
42
-
43
-
44
-
45
-
46
-
47
-
48
-
49
-
50
-
51
-
52
-
53
-
54
-
55
-
56
-
57
-
58
-
59
-
60
-
61
-
62
-
63
-
64
-
65
-
66
-
67
-
68
-
69
-
70
-
71
-
72
-
73
-
74
-
75
-
76
-
77
-
78
-
79
-
80
-
81
-
82
-
83
-
84
-
85
-
86
-
87
-
88
-
89
-
90
-
91
-
92
-
93
-
94
-
95
-
96
-
97
-
98
-
99
-
100
-
101
-
102
-
103
-
104
-
105
-
106
-
107
-
108
-
109
-
110
-
111
-
112
-
113
-
114
-
115
-
116
-
117
-
118
-
119
-
120
-
121
-
122
-
123
-
124
-
125
-
126
-
127
-
128
-
129
-
130
-
131
-
132
-
133
-
134
-
135
-
136
-
137
-
138
-
139
-
140
-
141
-
142
-
143
-
144
-
145
-
146
-
147
-
148
-
149
-
150
-
151
-
152
-
153
-
154
-
155
-
156
-
157
-
158
-
159
-
160
-
161
-
162
-
163
-
164
-
165
-
166
-
167
-
168
-
169
-
170
-
171
-
172
-
173
-
174
-
175
-
176
-
177
-
178
-
179
-
180
-
181
-
182
-
183
-
184
-
185
-
186
-
187
-
188
-
189
-
190
-
191
-
192
-
193
-
194
-
195
-
196
-
197
-
198
-
199
-
200
-
201
-
202
-
203
-
204
-
205
-
206
-
207
-
208
-
209
-
210
-
211
-
212
-
213
-
214
-
215
-
216
-
217
-
218
-
219
-
220
-
221
-
222
-
223
-
224
-
225
-
226
-
227
-
228
-
229
-
230
-
231
-
232
-
233
-
234
-
235
-
236
-
237
-
238
-
239
-
240
-
241
-
242
-
243
-
244
-
245
-
246
-
247
-
248
-
249
-
250
-
251
-
252
-
253
-
254
-
255
-
256
-
257
-
258
-
259
-
260
-
261
-
262
-
263
-
264
-
265
-
266
-
267
-
268
-
269
-
270
-
271
-
272
-
273
-
274
-
275
-
276
-
277
-
278
-
279
-
280
-
281
-
282
-
283
-
284
-
285
-
286
-
287
-
288
-
289
-
290
-
291
-
292
-
293
-
294
-
295
-
296
-
297
-
298
-
299
-
300
 |
 |

29
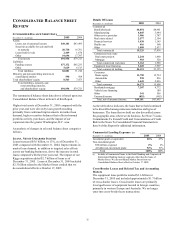
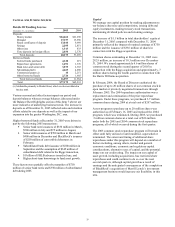
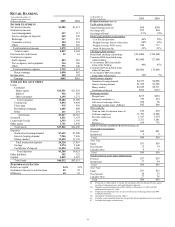
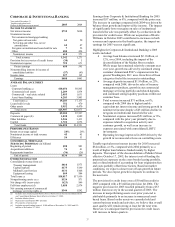
CAPITAL AND FUNDING SOURCES
Details Of Funding Sources
December 31 - in millions 2005 2004
Deposits
Money market $24,462 $21,250
Demand 17,157 15,996
Retail certificates of deposit 13,010 9,969
Savings 2,295 2,851
Other time 1,313 833
Time deposits in foreign offices 2,038 2,370
Total deposits 60,275 53,269
Borrowed funds
Federal funds purchased 4,128 219
Repurchase agreements 1,691 1,376
Bank notes and senior debt 3,875 2,383
Subordinated debt 4,469 4,050
Commercial paper (a) 10 2,251
Other borrowed funds 2,724 1,685
Total borrowed funds 16,897 11,964
Total $77,172 $65,233
(a) Attributable primarily to Market Street, which was deconsolidated in
October 2005.
Various seasonal and other factors impact our period-end
deposit balances whereas average balances (discussed under
the Balance Sheet Highlights section of this Item 7 above) are
more indicative of underlying business trends. The increase in
deposits as of December 31, 2005 reflected sales and retention
efforts related to core deposits as well as the impact of our
expansion into the greater Washington, D.C. area.
Higher borrowed funds at December 31, 2005 were driven in
part by the following 2005 transactions:
• Senior bank note issuances of $350 million in March,
$500 million in July and $75 million in August,
• Senior debt issuances of $700 million in March and
$400 million in December and BlackRock’ s issuance
of $250 million of convertible debentures in
February,
• Subordinated bank debt issuance of $500 million in
September and the assumption of $345 million of
subordinated debt related to the Riggs transaction,
• $1 billion of FHLB advances issued in June, and
• Higher short-term borrowings to fund asset growth.
.
These factors were partially offset by maturities of $750
million of senior bank notes and $350 million of subordinated
debt during 2005.
Capital
We manage our capital position by making adjustments to
our balance sheet size and composition, issuing debt and
equity instruments, making treasury stock transactions,
maintaining dividend policies and retaining earnings.
The increase of $1.1 billion in total shareholders’ equity at
December 31, 2005 compared with December 31, 2004
primarily reflected the impact of retained earnings of $750
million and the issuance of $356 million of shares in
connection with the Riggs acquisition.
Common shares outstanding at December 31, 2005 were
292.9 million, an increase of 10.3 million over December
31, 2004. We issued approximately 6.6 million shares of
common stock during the second quarter of 2005 in
connection with the Riggs acquisition and approximately .7
million shares during the fourth quarter in connection with
the Harris Williams acquisition.
In February 2004, the Board of Directors authorized the
purchase of up to 20 million shares of our common stock in
open market or privately negotiated transactions through
February 2005. The 2004 repurchase authorization was a
replacement and continuation of the prior repurchase
program. Under these programs, we purchased 3.7 million
common shares during 2004 at a total cost of $207 million.
A new program to purchase up to 20 million shares was
authorized as of February 16, 2005 and replaced the 2004
program, which was terminated. During 2005, we purchased
.5 million common shares at a total cost of $26 million
under both the 2005 and 2004 common stock repurchase
programs, all of which occurred during the first quarter.
The 2005 common stock repurchase program will remain in
effect until fully utilized or until modified, superseded or
terminated. The extent and timing of additional share
repurchases under this program will depend on a number of
factors including, among others, market and general
economic conditions, economic and regulatory capital
considerations, alternative uses of capital, and the potential
impact on our credit rating. The impact on our capital of
asset growth, including acquisitions, has restricted share
repurchases and could continue to do so over the next
several quarters, although capital growth as a result of
earnings and the anticipated consequences of the completion
of BlackRock’ s acquisition of Merrill Lynch’ s investment
management business would increase our flexibility in this
area.