Nokia 2013 Annual Report Download - page 99
Download and view the complete annual report
Please find page 99 of the 2013 Nokia annual report below. You can navigate through the pages in the report by either clicking on the pages listed below, or by using the keyword search tool below to find specific information within the annual report.-
 1
1 -
2
-
3
-
4
-
5
-
6
-
7
-
8
-
9
-
10
-
11
-
12
-
13
-
14
-
15
-
16
-
17
-
18
-
19
-
20
-
21
-
22
-
23
-
24
-
25
-
26
-
27
-
28
-
29
-
30
-
31
-
32
-
33
-
34
-
35
-
36
-
37
-
38
-
39
-
40
-
41
-
42
-
43
-
44
-
45
-
46
-
47
-
48
-
49
-
50
-
51
-
52
-
53
-
54
-
55
-
56
-
57
-
58
-
59
-
60
-
61
-
62
-
63
-
64
-
65
-
66
-
67
-
68
-
69
-
70
-
71
-
72
-
73
-
74
-
75
-
76
-
77
-
78
-
79
-
80
-
81
-
82
-
83
-
84
-
85
-
86
-
87
-
88
-
 89
89 -
 90
90 -
 91
91 -
 92
92 -
 93
93 -
 94
94 -
 95
95 -
 96
96 -
 97
97 -
 98
98 -
 99
99 -
 100
100 -
 101
101 -
 102
102 -
 103
103 -
 104
104 -
 105
105 -
 106
106 -
 107
107 -
 108
108 -
 109
109 -
110
-
111
-
112
-
113
-
114
-
115
-
116
-
117
-
118
-
119
-
120
-
121
-
122
-
123
-
124
-
125
-
126
-
127
-
128
-
129
-
130
-
131
-
132
-
133
-
134
-
135
-
136
-
137
-
138
-
139
-
140
-
141
-
142
-
143
-
144
-
145
-
146
 |
 |

97
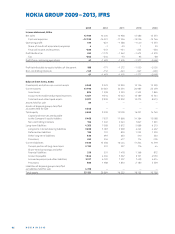
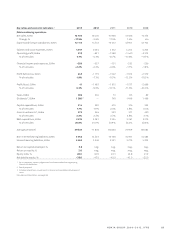
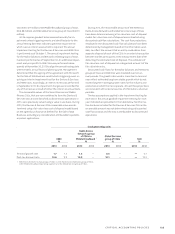
NOKIA GROUP 2009–2013, IFRS
Key ratios and economic indicators 1 2013 2012 2011 2010 2009
Nokia continuing operations
Net sales, EURm 12709 15400 15968 13586 13373
Change, % – 17.5% – 3.6% 17.5% 1.6% n/a
Exports and foreign subsidiaries, EURm 12115 14741 15013 12907 12704
Salaries and social expenses, EURm 4041 5034 4612 4204 4203
Operating profi t, EURm 519 – 821 – 1388 – 1440 – 2373
% of net sales 4.1% – 5.3% – 8.7% – 10.6% – 17.7%
Financial income and expenses, EURm – 2 80 – 357 – 131 – 233 – 236
% of net sales – 2 . 2% – 2.3% – 0.8 % – 1.7% – 1.8%
Profi t before tax, EURm 243 – 1179 – 1542 – 1672 – 2579
% of net sales 1.9% – 7.7% – 9.7% – 12.3% – 19.3%
Profi t/(loss), EURm 41 – 1483 – 1615 – 1577 – 2668
% of net sales 0.3% – 9. 6% – 10.1% – 11.6% – 20 .0 %
Taxes, EURm 202 304 73 -95 89
Dividends 2, EURm 1 386 2 — 749 1498 1498
Capital expenditure, EURm 214 290 410 376 322
% of net sales 1.7% 1.9% 2.6% 2.8% 2.4%
Gross investments 3, EURm 275 346 523 511 420
% of net sales 2.2% 2.2% 3.3% 3.8% 3.1%
R&D expenditure, EURm 2619 3081 3334 3261 3019
% of net sales 20.6% 20.0% 20.9% 24.0% 22.6%
Average personnel 59333 71808 80856 73959 69684
Non-interest bearing liabilities, EURm 6 946 14253 16168 16591 14483
Interest-bearing liabilities, EURm 6662 5549 5321 5279 5203
Return on capital employed, % 5.6 neg. neg. neg. neg.
Return on equity, % 2.6 neg. neg. neg. neg.
Equity ratio, % 28.0 32.9 40.1 42.8 41.9
Net debt to equity, % – 35 .0 – 47.0 – 4 0. 0 – 43.0 – 25. 0
As is customary, certain judgements have been made when regrouping
historical information.
Board proposal
Includes acquisitions, investments in shares and capitalized development
costs.
Calculation of Key Ratios, see page .