Nokia 2013 Annual Report Download - page 44
Download and view the complete annual report
Please find page 44 of the 2013 Nokia annual report below. You can navigate through the pages in the report by either clicking on the pages listed below, or by using the keyword search tool below to find specific information within the annual report.-
 1
1 -
2
-
3
-
4
-
5
-
6
-
7
-
8
-
9
-
10
-
11
-
12
-
13
-
14
-
15
-
16
-
17
-
18
-
19
-
20
-
21
-
22
-
23
-
24
-
25
-
26
-
27
-
28
-
29
-
30
-
31
-
32
-
33
-
 34
34 -
 35
35 -
 36
36 -
 37
37 -
 38
38 -
 39
39 -
 40
40 -
 41
41 -
 42
42 -
 43
43 -
 44
44 -
 45
45 -
 46
46 -
 47
47 -
 48
48 -
 49
49 -
 50
50 -
 51
51 -
 52
52 -
 53
53 -
 54
54 -
55
-
56
-
57
-
58
-
59
-
60
-
61
-
62
-
63
-
64
-
65
-
66
-
67
-
68
-
69
-
70
-
71
-
72
-
73
-
74
-
75
-
76
-
77
-
78
-
79
-
80
-
81
-
82
-
83
-
84
-
85
-
86
-
87
-
88
-
89
-
90
-
91
-
92
-
93
-
94
-
95
-
96
-
97
-
98
-
99
-
100
-
101
-
102
-
103
-
104
-
105
-
106
-
107
-
108
-
109
-
110
-
111
-
112
-
113
-
114
-
115
-
116
-
117
-
118
-
119
-
120
-
121
-
122
-
123
-
124
-
125
-
126
-
127
-
128
-
129
-
130
-
131
-
132
-
133
-
134
-
135
-
136
-
137
-
138
-
139
-
140
-
141
-
142
-
143
-
144
-
145
-
146
 |
 |

NOKIA IN 2013
42
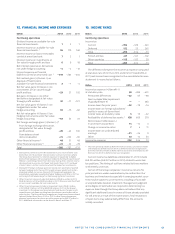
Results of discontinued
operations, EURm 2013 2012 2011
Net sales 10735 15152 23091
Cost of sales – 8526 – 12320 – 17292
Gross profi t 2209 2832 5799
Research and development
expenses – 1130 – 1658 – 2211
Selling and marketing expenses – 1345 – 1857 –2179
Administrative and
general expenses – 215 – 286 – 370
Other income and expenses – 109 – 510 – 723
Operating loss (–)/profi t (+) – 590 – 1479 316
Financial income (+)/expense (–) 10 18 28
Income tax – 200 – 842 – 216
Loss (–)/profi t (+) for the year – 780 – 2303 128
Depriciation and amortization 168 238 244
Cash fl ows (used in) discontinued
operation, EURm 2013 2012 2011
Net cash used
in operating activities – 1062 – 2252 – 95
Net cash used
in investing activities – 130 – 68 – 206
Net cash used
in fi nancing activities – 21 — —
Net cash fl ow for the year – 1213 – 2320 – 301
Devices & Services is comprised of two previously report-
able segments, Smart Devices and Mobile Phones as well as
Devices & Services Other. Smart Devices focuses on Nokia’s
most advanced products, including smartphones powered by
the Windows Phone system and has profi t-and-loss respon-
sibility and end-to-end accountability for the full consumer
experience, including product development, product man-
agement and product marketing. Mobile Phones focuses on
the area of mass market entry and feature phones as well as
aff ordable smart phones and has profi t-and-loss responsibility
and end-to-end accountability for the full consumer experi-
ence, including development, management and marketing of
feature phone products, services and applications. Devices
& Services Other includes net sales related to spare parts,
related cost of sales and operating expenses and operating
results of Vertu through October , , the date of divest-
ment of the business. Devices & Services Other also includes
major restructuring projects/programs related to the Devices
& Services business as well as other unallocated items.
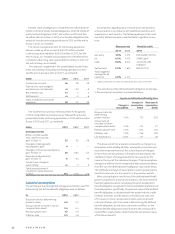
Eff ect of disposal on the fi nancial
position of the Group, EURm 2013
Goodwill and other intangible assets 1426
Property plant and equipment 559
Deferred tax assets and non-current assets 381
Inventories 347
Trade and other receivables 691
Prepaid and other current assets 1854
Assets of disposal groups
classifi ed as held for sale 5258
Deferred tax liabilities and other liabilities 114
Trade and other payables 1381
Deferred income and accrued expense 2220
Provisions 1013
Liabilities of disposal groups
classifi ed as held for sale 4 728
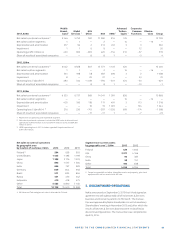
4. PERCENTAGE OF COMPLETION
Contract sales recognized under percentage of completion
accounting were EUR million in (EUR million in
and EUR million in ). Service revenue for managed
services and network maintenance contracts were EUR in
(EUR million in and EUR million in ).
Advances received related to construction contracts,
included in accrued expenses and other liabilities, are EUR
million at December , (EUR million in ). Included
in accounts receivable are contract revenues recorded prior to
billings of EUR million at December , (EUR million
in ) and billings in excess of costs incurred are EUR mil-
lion at December , (EUR million in ).
The aggregate amount of costs incurred and recognized
profi ts (net of recognized losses) under construction con-
tracts in progress since inception is EUR million at
December, (EUR million in ).
Retentions related to construction contracts, included in
accounts receivable, are EUR million at December ,
(EUR million at December , ).
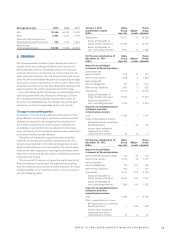
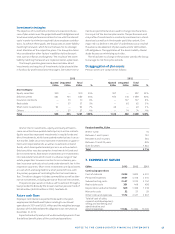
5. PERSONNEL EXPENSES
Continuing operations, EURm 2013 2012 2011
Wages and salaries 3432 4295 3875
Share-based
compensation expense 42 11 6
Pension expenses, net 206 232 220
Other social expenses 403 507 517
Personnel expenses total 4083 5045 4618
Personnel expenses include termination benefi ts.
Pension expenses, comprised of multi-employer, insured
and defi ned contribution plans were EUR million in
(EUR million in and EUR million in ). Expenses
related to defi ned benefi t plans comprise the remainder.