Nokia 2013 Annual Report Download - page 14
Download and view the complete annual report
Please find page 14 of the 2013 Nokia annual report below. You can navigate through the pages in the report by either clicking on the pages listed below, or by using the keyword search tool below to find specific information within the annual report.-
 1
1 -
2
-
3
-
 4
4 -
 5
5 -
 6
6 -
 7
7 -
 8
8 -
 9
9 -
 10
10 -
 11
11 -
 12
12 -
 13
13 -
 14
14 -
 15
15 -
 16
16 -
 17
17 -
 18
18 -
 19
19 -
 20
20 -
 21
21 -
 22
22 -
 23
23 -
 24
24 -
25
-
26
-
27
-
28
-
29
-
30
-
31
-
32
-
33
-
34
-
35
-
36
-
37
-
38
-
39
-
40
-
41
-
42
-
43
-
44
-
45
-
46
-
47
-
48
-
49
-
50
-
51
-
52
-
53
-
54
-
55
-
56
-
57
-
58
-
59
-
60
-
61
-
62
-
63
-
64
-
65
-
66
-
67
-
68
-
69
-
70
-
71
-
72
-
73
-
74
-
75
-
76
-
77
-
78
-
79
-
80
-
81
-
82
-
83
-
84
-
85
-
86
-
87
-
88
-
89
-
90
-
91
-
92
-
93
-
94
-
95
-
96
-
97
-
98
-
99
-
100
-
101
-
102
-
103
-
104
-
105
-
106
-
107
-
108
-
109
-
110
-
111
-
112
-
113
-
114
-
115
-
116
-
117
-
118
-
119
-
120
-
121
-
122
-
123
-
124
-
125
-
126
-
127
-
128
-
129
-
130
-
131
-
132
-
133
-
134
-
135
-
136
-
137
-
138
-
139
-
140
-
141
-
142
-
143
-
144
-
145
-
146
 |
 |

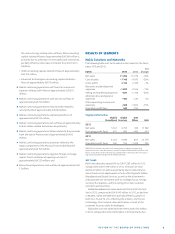
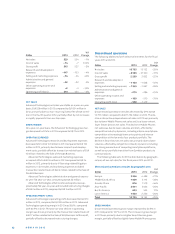
NOKIA IN 2013
12
YoY
EURm 2013 2012 Change
Net sales 529 534 – 1%
Cost of sales – 14 – 7 100%
Gross profi t 515 527 – 2%
Research and development
expenses – 147 – 153 – 4%
Selling and marketing expenses – 34 – 24 42%
Administrative and general
expenses – 22 – 22 0%
Other operating income and
expenses – 2 – 3 – 33%
Operating profi t (loss) 310 325 – 5%
NET SALES
Advanced Technologies net sales was stable on a year-on-year
basis, EUR million in compared to EUR million in
, primarily due to a non-recurring license fee of EUR mil-
lion in the fourth quarter , partially off set by net increases
in royalty payments from our licensees.
GROSS MARGIN
On a year-on-year basis, the Advanced Technology gross mar-
gin decreased to .% in compared to .% in .
OPERATING EXPENSES
Advanced Technologies research and development expenses
decreased % to EUR million in compared to EUR
million in , primarily due to lower research and develop-
ment costs, partially off set by transaction related costs of EUR
million related to the Sale of the D&S Business.
Advanced Technologies sales and marketing expenses
increased % to EUR million in compared to EUR
million in , primarily due to IP licensing related litigation
expenses. In sales and marketing expenses included
transaction related costs of EUR million related to the Sale of
the D&S Business.
Advanced Technologies administrative and general expens-
es were fl at year-on-year, amounting to EUR million.
Advanced Technologies other income and expense was ap-
proximately fl at year-on-year, and included restructuring charges
of EUR million in , compared to EUR million in .
OPERATING PROFIT (LOSS)
Advanced Technologies operating profi t decreased to EUR
million in , compared to EUR million in . Advanced
Technologies operating margin in was .%, compared
with .% in . The year-on-year decline in operating
margin was driven primarily by the transaction related costs of
EUR million related to the Sale of D&S Business to Microsoft,
partially off set by decreased restructuring charges.
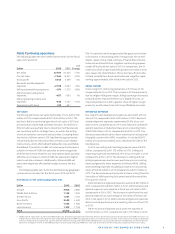
Discontinued operations
The following table sets forth selective line items for the fi scal
years and .
YoY
EURm 2013 2012 Change
Net sales 10 735 15 152 – 29%
Cost of sales – 8 526 – 12 320 – 31%
Gross profi t 2 209 2 832 – 22%
Research and development
expenses – 1 130 – 1 658 – 32%
Selling and marketing expenses – 1 345 – 1 857 – 28%
Administrative and general
expenses – 215 – 286 – 25%
Other operating income and
expenses – 109 – 510 – 79%
Operating profi t (loss) – 590 – 1 479
NET SALES
Discontinued operations net sales decreased by % to EUR
million compared to EUR million in . The de-
cline in discontinued operations net sales in was primarily
due to lower Mobile Phones net sales and, to a lesser extent,
lower Smart Devices net sales. The decline in Mobile Phones
net sales was due to lower volumes and ASPs, aff ected by
competitive industry dynamics, including intense smartphone
competition at increasingly lower price points and intense
competition at the low end of our product portfolio. The
decline in Smart Devices net sales was primarily due to lower
volumes, aff ected by competitive industry dynamics including
the strong momentum of competing smartphone platforms,
as well as our portfolio transition from Symbian products to
Lumia products.
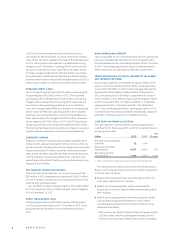
The following table sets forth the distribution by geographi-
cal area of our net sales for the fi scal years and .
Discontinued operations net sales by geographic area
YoY
EURm 2013 2012 Change
Europe 3 266 4 498 – 27%
Middle East & Africa 1 689 2 712 – 38%
Greater China 816 1 519 – 46%
Asia–Pacifi c 2 691 3 655 – 26%
North America 623 532 17%
Latin America 1 650 2 236 – 26%
Total 10 735 15 152 – 29%
GROSS MARGIN
Discontinued operations gross margin improved to .% in
compared to .% in . The increase in gross margin
in was primarily due to a higher Smart Devices gross
margin, partially off set by slightly lower Mobile Phones gross