Nokia 2013 Annual Report Download - page 64
Download and view the complete annual report
Please find page 64 of the 2013 Nokia annual report below. You can navigate through the pages in the report by either clicking on the pages listed below, or by using the keyword search tool below to find specific information within the annual report.-
 1
1 -
2
-
3
-
4
-
5
-
6
-
7
-
8
-
9
-
10
-
11
-
12
-
13
-
14
-
15
-
16
-
17
-
18
-
19
-
20
-
21
-
22
-
23
-
24
-
25
-
26
-
27
-
28
-
29
-
30
-
31
-
32
-
33
-
34
-
35
-
36
-
37
-
38
-
39
-
40
-
41
-
42
-
43
-
44
-
45
-
46
-
47
-
48
-
49
-
50
-
51
-
52
-
53
-
 54
54 -
 55
55 -
 56
56 -
 57
57 -
 58
58 -
 59
59 -
 60
60 -
 61
61 -
 62
62 -
 63
63 -
 64
64 -
 65
65 -
 66
66 -
 67
67 -
 68
68 -
 69
69 -
 70
70 -
 71
71 -
 72
72 -
 73
73 -
 74
74 -
75
-
76
-
77
-
78
-
79
-
80
-
81
-
82
-
83
-
84
-
85
-
86
-
87
-
88
-
89
-
90
-
91
-
92
-
93
-
94
-
95
-
96
-
97
-
98
-
99
-
100
-
101
-
102
-
103
-
104
-
105
-
106
-
107
-
108
-
109
-
110
-
111
-
112
-
113
-
114
-
115
-
116
-
117
-
118
-
119
-
120
-
121
-
122
-
123
-
124
-
125
-
126
-
127
-
128
-
129
-
130
-
131
-
132
-
133
-
134
-
135
-
136
-
137
-
138
-
139
-
140
-
141
-
142
-
143
-
144
-
145
-
146
 |
 |

NOKIA IN 2013
62
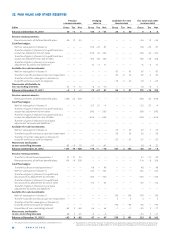
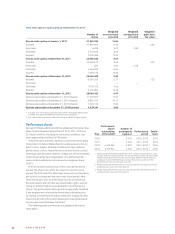
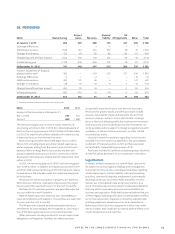
Total stock options outstanding as at December ,
Weighted Weighted Weighted
Numberof exercise share average share grant date
shares priceEUR price EUR fair value 2
Shares under option at January1, 2011 21945296 14.04
Granted 11801907 5.50 0.92
Exercised 6208 5.07 7.69
Forfeited 2441876 9.05
Expired 7909089 17.53
Shares under option at December 31, 2011 23390030 9.07
Granted 10 258 400 2.32 0.76
Exercised 627 0.97 2.08
Forfeited 4 246 222 6.60
Expired 3 555 213 15.26
Shares under option at December31, 2012 25 846 368 5.95
Granted 8 334 200 2.77 1.23
Exercised — — —
Forfeited 3 705 512 4.06
Expired 2 474 864 14.78
Shares under option at December31, 2013 28 000 192 4.47
Options exercisable at December31, 2010 (shares) 11 376 937 17.07
Options exercisable at December31, 2011 (shares) 6 904 331 14.01
Options exercisable at December31, 2012 (shares) 5 616 112 11.96
Options exercisable at December31, 2013 (shares) 4 339 341 9.66
Includes also stock options granted under other than global equity plans,
however excluding the NSN share-based incentive program.
Fair value of stock options is calculated using the Black-Scholes model.
Performance shares
During Nokia administered four global performance share
plans, the Performance Share Plans of , , and
each of which, including its terms and conditions, has
been approved by the Board of Directors.
The performance shares represent a commitment by Nokia
Corporation to deliver Nokia shares to employees at a future
point in time, subject to Nokia’s fulfi llment of pre-defi ned
performance criteria. No performance shares will vest unless
the Group’s performance reaches at least one of the threshold
levels measured by two independent, pre-defi ned perfor-
mance criteria related to net sales and earnings per share
(“EPS”).
The and plans have a three-year performance
period. The shares vest after the respective performance
period. The and plans have a two-year performance
period and a subsequent one-year restriction period, after
which the shares vest. Until the Nokia shares are delivered,
the participants will not have any shareholder rights, such as
voting or dividend rights associated with the performance
shares. The performance share grants are generally forfeited
if the employment relationship terminates with Nokia prior
to vesting. Unvested performance shares for employees who
have transferred to Microsoft following the sale of Devices &
Services business have been forfeited.
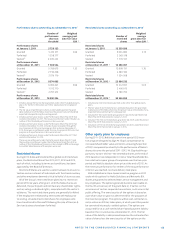
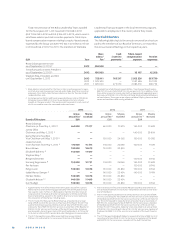
The following table summarizes our global performance
share plans.
Performance
shares Number of
outstanding participants Performance Settle-
Plan at threshold 1 (approx.) period ment
2010 — 3000 2010 – 2012 2013
2011 — 2 200 2011 – 2013 2014
2012 4476263 2 800 2012 – 2013 2 2015
2013 6 513 941 3 500 2013 – 2014 3 2016
Shares under Performance Share Plan vested on December ,
and are therefore not included in the outstanding numbers. Shares under
Performance Share Plan are outstanding, however there will be no
settlement under the Performance Share Plan as neither of the
performance criteria of the plan was met.
Performance Share Plan has a two-year performance period with an
additional one-year restriction period.
Performance Share Plan has a two-year performance period with an
additional one-year restriction period.