Nokia 2013 Annual Report Download - page 135
Download and view the complete annual report
Please find page 135 of the 2013 Nokia annual report below. You can navigate through the pages in the report by either clicking on the pages listed below, or by using the keyword search tool below to find specific information within the annual report.-
 1
1 -
2
-
3
-
4
-
5
-
6
-
7
-
8
-
9
-
10
-
11
-
12
-
13
-
14
-
15
-
16
-
17
-
18
-
19
-
20
-
21
-
22
-
23
-
24
-
25
-
26
-
27
-
28
-
29
-
30
-
31
-
32
-
33
-
34
-
35
-
36
-
37
-
38
-
39
-
40
-
41
-
42
-
43
-
44
-
45
-
46
-
47
-
48
-
49
-
50
-
51
-
52
-
53
-
54
-
55
-
56
-
57
-
58
-
59
-
60
-
61
-
62
-
63
-
64
-
65
-
66
-
67
-
68
-
69
-
70
-
71
-
72
-
73
-
74
-
75
-
76
-
77
-
78
-
79
-
80
-
81
-
82
-
83
-
84
-
85
-
86
-
87
-
88
-
89
-
90
-
91
-
92
-
93
-
94
-
95
-
96
-
97
-
98
-
99
-
100
-
101
-
102
-
103
-
104
-
105
-
106
-
107
-
108
-
109
-
110
-
111
-
112
-
113
-
114
-
115
-
116
-
117
-
118
-
119
-
120
-
121
-
122
-
123
-
124
-
 125
125 -
 126
126 -
 127
127 -
 128
128 -
 129
129 -
 130
130 -
 131
131 -
 132
132 -
 133
133 -
 134
134 -
 135
135 -
 136
136 -
 137
137 -
 138
138 -
 139
139 -
 140
140 -
 141
141 -
 142
142 -
 143
143 -
 144
144 -
 145
145 -
146
 |
 |

133
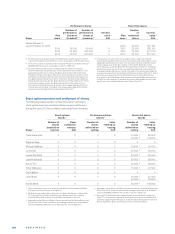
COMPENSATION OF THE BOARD OF DIRECTORS AND THE NOKIA GROUP LEADERSHIP TEAM
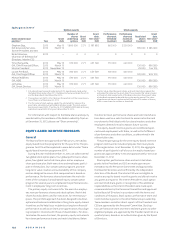
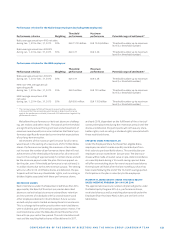
Shares Shares
Shares receivable receivable Shares
receivable through through receivable
through performance performance through
stock shares at shares at restricted
Shares options threshold 4 maximum 5 shares
Number of equity instruments held by
Nokia Leadership Team 1 1 005 150 10 271 500 1 462 500 5 850 000 4 264 000
% of the outstanding shares 2 0.03 0.28 0.04 0.16 0.11
% of the total outstanding
equity incentives
(per instrument) 3 36.81 22.45 22.45 14.05
Share ownership of the Nokia Leadership Team
The following table sets forth the share ownership, as well as
potential ownership interest through the holding of equity-
based incentives, of the members of the Nokia Leadership
Team as at December , .
Includes Nokia Leadership Team members at year end. Figures do not
include those former Nokia Leadership Team members who left during
.
The percentage is calculated in relation to the outstanding number of
shares and total voting rights of the company, excluding shares held by
Nokia Group. Each Nokia Leadership Team member owns less than % of
Nokia shares.
The percentage is calculated in relation to the total outstanding equity
incentives per instrument.
No Nokia shares were delivered under the Nokia Performance Share Plan
, which vested in . Nokia’s performance did not reach the requi-
site threshold level with respect to the applicable performance criteria.
Therefore, the shares deliverable at threshold equaled zero and no Nokia
shares were delivered pursuant to the Nokia Performance Share Plan .
No Nokia shares were delivered under the Nokia Performance Share Plan
, which vested in . Nokia’s performance did not reach the requi-
site threshold level with respect to the applicable performance criteria.
Therefore, the shares deliverable at maximum equaled zero and no Nokia
shares were delivered pursuant to the Nokia Performance Share Plan .
There will also be no payout under the Nokia Performance Share Plan.
At maximum performance under the Nokia Performance Share Plans ,
the number of shares deliverable equals four times the number of perfor-
mance shares at threshold. At the end of the performance period for the
Nokia Performance Share Plan , which ended on December , ,
the threshold performance criteria for net sales and EPS were not met.
Therefore, there will be no payout under the Nokia Performance Share
Plan as the threshold level under the applicable performance criteria
was not reached.
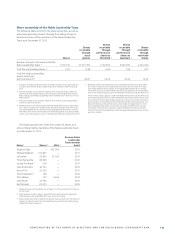
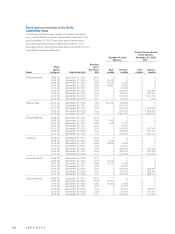
The following table sets forth the number of shares and
ADSs in Nokia held by members of the Nokia Leadership Team
as of December , .
Became Nokia
Leadership
Team member
Name 1 Shares 2 ADSs2 (year)
Stephen Elop — 425 000 2010
Michael Halbherr 210 823 — 2011
Jo Harlow 25 830 25 000 2011
Timo Ihamuotila 89 990 — 2007
Louise Pentland 3 500 — 2011
Juha Putkiranta 45 734 — 2012
Henry Tirri 23 330 — 2011
Timo Toikkanen 3 159 — 2012
Chris Weber 157 5 460 2012
Juha Äkräs 42 794 — 2010
Kai Öistämö 110 373 — 2005
Marko Ahtisaari left the Nokia on October , and held shares
at that time.
Stock options or other equity awards that are deemed as being benefi-
cially owned under applicable SEC rules are not included.
Nokia Leadership Team member will be purchasing shares on the external
market in order to meet the shareholding requirements for Nokia Group
Leadership Team members.