Nokia 2013 Annual Report Download - page 58
Download and view the complete annual report
Please find page 58 of the 2013 Nokia annual report below. You can navigate through the pages in the report by either clicking on the pages listed below, or by using the keyword search tool below to find specific information within the annual report.-
 1
1 -
2
-
3
-
4
-
5
-
6
-
7
-
8
-
9
-
10
-
11
-
12
-
13
-
14
-
15
-
16
-
17
-
18
-
19
-
20
-
21
-
22
-
23
-
24
-
25
-
26
-
27
-
28
-
29
-
30
-
31
-
32
-
33
-
34
-
35
-
36
-
37
-
38
-
39
-
40
-
41
-
42
-
43
-
44
-
45
-
46
-
47
-
 48
48 -
 49
49 -
 50
50 -
 51
51 -
 52
52 -
 53
53 -
 54
54 -
 55
55 -
 56
56 -
 57
57 -
 58
58 -
 59
59 -
 60
60 -
 61
61 -
 62
62 -
 63
63 -
 64
64 -
 65
65 -
 66
66 -
 67
67 -
 68
68 -
69
-
70
-
71
-
72
-
73
-
74
-
75
-
76
-
77
-
78
-
79
-
80
-
81
-
82
-
83
-
84
-
85
-
86
-
87
-
88
-
89
-
90
-
91
-
92
-
93
-
94
-
95
-
96
-
97
-
98
-
99
-
100
-
101
-
102
-
103
-
104
-
105
-
106
-
107
-
108
-
109
-
110
-
111
-
112
-
113
-
114
-
115
-
116
-
117
-
118
-
119
-
120
-
121
-
122
-
123
-
124
-
125
-
126
-
127
-
128
-
129
-
130
-
131
-
132
-
133
-
134
-
135
-
136
-
137
-
138
-
139
-
140
-
141
-
142
-
143
-
144
-
145
-
146
 |
 |

NOKIA IN 2013
56
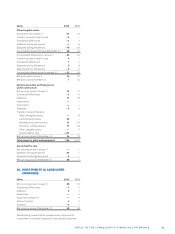
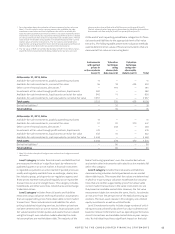
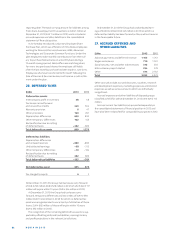
fair value. The following table shows a reconciliation of the
opening and closing balances of Level fi nancial assets:
Otheravailable-
for-sale investments
EURm carried at fair value
Balance at December31, 2011 346
Total losses in consolidated income statement – 8
Total gains recorded in other comprehensive income 34
Purchases 41
Sales – 35
Other transfers – 8
Balance at December31, 2012 370
Total gains in consolidated income statement 81
Total gains recorded in other comprehensive income 52
Purchases 47
Sales – 123
Other transfers 2
Balance at December31, 2013 429
The gains and losses from fi nancial assets categorized in
level are included in other operating income and expenses as
the investment and disposal objectives for these investments
are business driven. A net loss of EUR million (net loss of EUR
million in ) related to level fi nancial instruments held
at December , , was included in the profi t and loss dur-
ing .
In the fourth quarter management has concluded
that certain real estate properties meet the criteria of assets
held for sale. These long lived assets have been identifi ed for
disposal as part of the on-going restructuring activities. Nokia
expects to realize the sale of these properties within the fol-
lowing twelve months. At December , the fair value of
these assets is EUR million. The valuation of these assets is
based on third-party evaluations by real estate brokers taking
into account Nokia’s divestment strategy for these assets as
well as relevant market dynamics. This evaluation includes
non-market observable inputs and hence these assets are
considered to be level category assets that are measured at
fair value on a non-recurring basis.
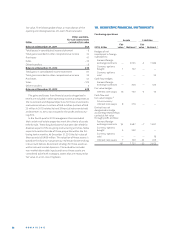
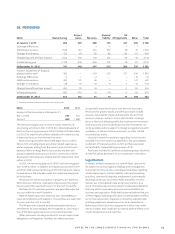
18. DERIVATIVE FINANCIAL INSTRUMENTS
Continuing operations
Assets Liabilities
Fair Fair
2013, EURm value 1 Notional 2 value 1 Notional 2
Hedges of net
investment in foreign
subsidiaries:
Forward foreign
exchange contracts — 2 035 – 3 1 086
Currency options
bought 1 152 — —
Currency options
sold — — — 53
Cash fl ow hedges:
Forward foreign
exchange contracts — 308 — 453
Fair value hedges
Interest rate swaps 76 750 – 3 73
Cash fl ow and
fair value hedges: 3
Cross currency
interest rate swaps 8 378 — —
Derivatives not
designated in hedge
accounting relationships
carried at fair value
through profi t and loss:
Forward foreign
exchange contracts 94 3 687 – 7 1 691
Currency options
bought 5 332 — —
Currency options
sold — — — 18
Interest rate swaps 7 109 – 22 249
191 7 751 – 35 3 623