Nokia 2013 Annual Report Download - page 48
Download and view the complete annual report
Please find page 48 of the 2013 Nokia annual report below. You can navigate through the pages in the report by either clicking on the pages listed below, or by using the keyword search tool below to find specific information within the annual report.-
 1
1 -
2
-
3
-
4
-
5
-
6
-
7
-
8
-
9
-
10
-
11
-
12
-
13
-
14
-
15
-
16
-
17
-
18
-
19
-
20
-
21
-
22
-
23
-
24
-
25
-
26
-
27
-
28
-
29
-
30
-
31
-
32
-
33
-
34
-
35
-
36
-
37
-
 38
38 -
 39
39 -
 40
40 -
 41
41 -
 42
42 -
 43
43 -
 44
44 -
 45
45 -
 46
46 -
 47
47 -
 48
48 -
 49
49 -
 50
50 -
 51
51 -
 52
52 -
 53
53 -
 54
54 -
 55
55 -
 56
56 -
 57
57 -
 58
58 -
59
-
60
-
61
-
62
-
63
-
64
-
65
-
66
-
67
-
68
-
69
-
70
-
71
-
72
-
73
-
74
-
75
-
76
-
77
-
78
-
79
-
80
-
81
-
82
-
83
-
84
-
85
-
86
-
87
-
88
-
89
-
90
-
91
-
92
-
93
-
94
-
95
-
96
-
97
-
98
-
99
-
100
-
101
-
102
-
103
-
104
-
105
-
106
-
107
-
108
-
109
-
110
-
111
-
112
-
113
-
114
-
115
-
116
-
117
-
118
-
119
-
120
-
121
-
122
-
123
-
124
-
125
-
126
-
127
-
128
-
129
-
130
-
131
-
132
-
133
-
134
-
135
-
136
-
137
-
138
-
139
-
140
-
141
-
142
-
143
-
144
-
145
-
146
 |
 |

NOKIA IN 2013
46
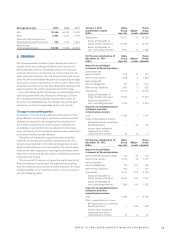
Present value of obligations include EUR million (EUR
million in ) of wholly funded obligations, EUR million of
partly funded obligations (EUR million in ) and EUR
million (EUR million in ) of unfunded obligations (the
amounts include continuing operations in and the entire
Group in , as restated).
The net accrued pension cost for continuing operations
above is made up of an accrual of EUR million included
in other long-term liabilities (EUR million in , for the
entire Group, as restated) and a prepayment of EUR million
included in other long-term assets (EUR million in , for
the entire Group, as restated).
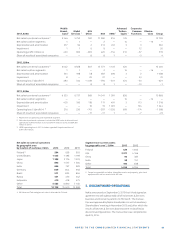
The amounts recognized in the consolidated income state-
ment are as follows (including continuing operations in
and the entire Group in and , as restated):
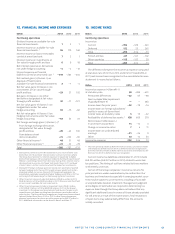
EURm 2013 2012 2011
Current service cost 44 58 59
Past service cost and gains
and losses on curtailments – 5 – 23 – 8
Net interest cost 11 5 3
Settlements – 4 – 3 – 6
Total, included in personnel
expenses 46 37 48
The movements in pension remeasurements recognized
in other comprehensive income are as follows (the amounts
presented include continuing operations in and the entire
Group in and , as restated):
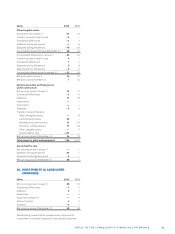
EURm 2013 2012 2011
Remeasurements
Return on plan assets
(excl. interest income),
gain (+)/loss (–) 15 62 – 18
Changes in demographic
assumptions, gain 4 — —
Changes in fi nancial assumptions,
gain (+)/loss (–) 93 – 264 – 43
Experience adjustments,
gain (+)/loss (–) 6 – 25 19
Current year change in
asset ceiling – 4 – 1 6
Total remeasurement
included in comprehensive
income 114 – 228 – 36
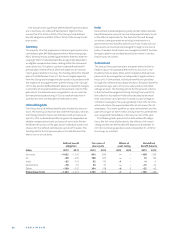
Actuarial assumptions
The principal actuarial weighted average assumptions used for
determining the defi ned benefi t obligation were as follows:
% 2013 2012
Discount rate for determining
present values 4.0 3.7
Annual rate of increase in future
compensation levels 2.4 2.4
Pension growth rate 1.7 1.9
Infl ation rate 2.0 1.8
Assumptions regarding future mortality are set based on
actuarial advice in accordance with published statistics and
experience in each country. The following discount rates and
mortality tables have been used for Nokia’s signifi cant coun-
tries:
Discountrate Mortalitytable
2013 2012 2013
Germany 3.6% 3.2% Richttafeln 2005 G
UK 4.5% 4.1% S1NA Light *
India 9.0% 8.3% LIC (2006-08)
Ultimate
Switzerland 2.2% 1.6% BVG 2010 G
Total weighted
average for all
countries 4.0% 3.7%
* Tables unadjusted for males and rated down by years for females.
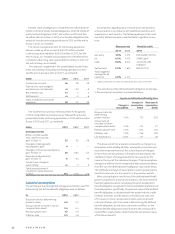
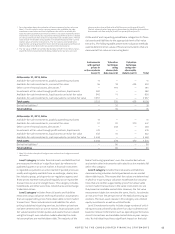
The sensitivity of the defi ned benefi t obligation to changes
in the principal assumptions is presented below.
Impact on defi ned benefi t obligation
Increasein Decreasein
Change in assumption assumption
assumption EURm EURm
Discount rate for
determining
present values 1.0% 173 -225
Annual rate of
increase in future
compensation levels 1.0% – 24 21
Pension growth rate 1.0% – 127 123
Infl ation rate 1.0% – 136 126
Life expectancy 1year – 27 26
The above sensitivity analyses are based on a change in an
assumption while holding all other assumptions constant and
may not be representative of the actual impact of changes.
If more than one assumption is changed simultaneously, the
combined impact of changes would not necessarily be the
same as the sum of the individual changes. If the assumptions
change to a diff erent level compared to that presented above,
the eff ect on the defi ned benefi t obligation may not be linear.
The methods and types of assumptions used in preparing the
sensitivity analyses are the same as in the previous period.
When calculating the sensitivity of the defi ned benefi t obli-
gation to signifi cant actuarial assumptions, the same method
has been applied as when calculating the post-employment
benefi t obligation recognized in the consolidated statement of
fi nancial position; specifi cally, the present value of the defi ned
benefi t obligation is calculated with the projected unit credit
method. Increases and decreases in the discount rate, rate
of increase in future compensation levels, pension growth
rate and infl ation, which are used in determining the defi ned
benefi t obligation, do not have a symmetrical eff ect on the
defi ned benefi t obligation primarily due to the compound in-
terest eff ect created when determining the net present value
of the future benefi t.