Nokia 2013 Annual Report Download - page 138
Download and view the complete annual report
Please find page 138 of the 2013 Nokia annual report below. You can navigate through the pages in the report by either clicking on the pages listed below, or by using the keyword search tool below to find specific information within the annual report.-
 1
1 -
2
-
3
-
4
-
5
-
6
-
7
-
8
-
9
-
10
-
11
-
12
-
13
-
14
-
15
-
16
-
17
-
18
-
19
-
20
-
21
-
22
-
23
-
24
-
25
-
26
-
27
-
28
-
29
-
30
-
31
-
32
-
33
-
34
-
35
-
36
-
37
-
38
-
39
-
40
-
41
-
42
-
43
-
44
-
45
-
46
-
47
-
48
-
49
-
50
-
51
-
52
-
53
-
54
-
55
-
56
-
57
-
58
-
59
-
60
-
61
-
62
-
63
-
64
-
65
-
66
-
67
-
68
-
69
-
70
-
71
-
72
-
73
-
74
-
75
-
76
-
77
-
78
-
79
-
80
-
81
-
82
-
83
-
84
-
85
-
86
-
87
-
88
-
89
-
90
-
91
-
92
-
93
-
94
-
95
-
96
-
97
-
98
-
99
-
100
-
101
-
102
-
103
-
104
-
105
-
106
-
107
-
108
-
109
-
110
-
111
-
112
-
113
-
114
-
115
-
116
-
117
-
118
-
119
-
120
-
121
-
122
-
123
-
124
-
125
-
126
-
127
-
 128
128 -
 129
129 -
 130
130 -
 131
131 -
 132
132 -
 133
133 -
 134
134 -
 135
135 -
 136
136 -
 137
137 -
 138
138 -
 139
139 -
 140
140 -
 141
141 -
 142
142 -
 143
143 -
 144
144 -
 145
145 -
 146
146
 |
 |

NOKIA IN 2013
136
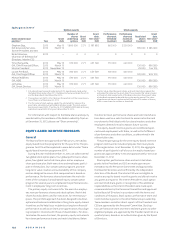
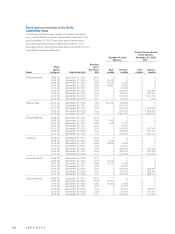
Total intrinsicvalue of
Number of stock stock options
options 1 EUR 6
Exercise
Stock price
option per share Exer- Unexer- Exer- Unexer-
Name category Expiration date EUR cisable cisable cisable 3 cisable
Marko Ahtisaari 5 2010 2Q December 31, 2015 8.86 21 933 5 067 0 0
as per 2011 2Q December 27, 2017 6.02 0 30 000 0 0
October 31, 2013 2011 3Q December 27, 2017 3.76 0 100 000 0 181 000
2012 2Q December 27, 2018 2.44 0 115 000 0 359 950
2013 2Q December 27, 2019 2.71 0 250 000 0 715 000
Mr.Ahtisaari’s stock option grants were forfeited and cancelled upon his
termination of employment in accordance with the plan rules.
The intrinsic value of the stock options is based on the difference
between the exercise price of the options and the closing market price of
Nokia shares on NASDAQ OMX Helsinki as at October , of EUR ..
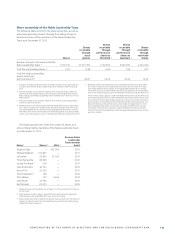
Performance shares and restricted shares
of the Nokia Leadership Team
The following table provides certain information relating to
performance shares and restricted shares held by members
of the Nokia Leadership Team as at December , . These
entitlements were granted pursuant to our Nokia Performance
Share Plans , and and Nokia Restricted Share
Plans , , and . For a description of our per-
formance share and restricted share plans, please see Note
to the consolidated fi nancial statements.
Performance shares Restricted shares
Intrinsic Intrinsic
Number of Number of value Number value
performance performance December31, of December31,
Plan shares at shares at 2013 4 Plan restricted 2013 6
Name name 1 threshold 2 maximum 3 EUR name 5 shares EUR
Timo Ihamuotila 2010 75 000 436 500
2011 0 0 0 2011 50 000 291 000
2012 0 0 0 2012 100 000 582 000
2013 110 000 440 000 0 2013 155 000 902 100
Stephen Elop 2010 100 000 582 000
2011 0 0 0 2011 180 000 1 047 600
2012 0 0 0 2012 500 000 2 910 000
2013 562 500 2 250 000 0 2013 785 000 4 568 700
Michael Halbherr 2010 17 000 98 940
2011 0 0 0 2011 50 000 291 000
2012 0 0 0 2012 100 000 582 000
2013 110 000 440 000 0 2013 130 000 756 600
Jo Harlow 2010 55 000 320 100
2011 0 0 0 2011 50 000 291 000
2012 0 0 0 2012 100 000 582 000
2013 110 000 440 000 0 2013 130 000 756 600
Louise Pentland 2010 55 000 320 100
2011 0 0 0 2011 35 000 203 700
2012 0 0 0 2012 75 000 436 500
2013 100 000 400 000 0 2013 120 000 698 400
Juha Putkiranta 2010 30 000 174 600
2011 0 0 0 2011 25 000 145 500
2012 0 0 0 2012 68 000 395 760
2013 75 000 300 000 0 2013 90 000 523 800