Nokia 2013 Annual Report Download - page 28
Download and view the complete annual report
Please find page 28 of the 2013 Nokia annual report below. You can navigate through the pages in the report by either clicking on the pages listed below, or by using the keyword search tool below to find specific information within the annual report.-
 1
1 -
2
-
3
-
4
-
5
-
6
-
7
-
8
-
9
-
10
-
11
-
12
-
13
-
14
-
15
-
16
-
17
-
 18
18 -
 19
19 -
 20
20 -
 21
21 -
 22
22 -
 23
23 -
 24
24 -
 25
25 -
 26
26 -
 27
27 -
 28
28 -
 29
29 -
 30
30 -
 31
31 -
 32
32 -
 33
33 -
 34
34 -
 35
35 -
 36
36 -
 37
37 -
 38
38 -
39
-
40
-
41
-
42
-
43
-
44
-
45
-
46
-
47
-
48
-
49
-
50
-
51
-
52
-
53
-
54
-
55
-
56
-
57
-
58
-
59
-
60
-
61
-
62
-
63
-
64
-
65
-
66
-
67
-
68
-
69
-
70
-
71
-
72
-
73
-
74
-
75
-
76
-
77
-
78
-
79
-
80
-
81
-
82
-
83
-
84
-
85
-
86
-
87
-
88
-
89
-
90
-
91
-
92
-
93
-
94
-
95
-
96
-
97
-
98
-
99
-
100
-
101
-
102
-
103
-
104
-
105
-
106
-
107
-
108
-
109
-
110
-
111
-
112
-
113
-
114
-
115
-
116
-
117
-
118
-
119
-
120
-
121
-
122
-
123
-
124
-
125
-
126
-
127
-
128
-
129
-
130
-
131
-
132
-
133
-
134
-
135
-
136
-
137
-
138
-
139
-
140
-
141
-
142
-
143
-
144
-
145
-
146
 |
 |

NOKIA IN 2013
26
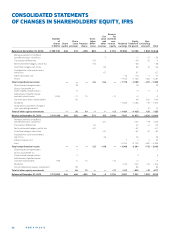
CONSOLIDATED STATEMENTS
OF CHANGES IN SHAREHOLDERS’ EQUITY, IFRS
Reserve
Fair for
Number Trans- value invested
of Share lation and non- Equity Non-
shares Share issue Treasury diff er- other restrict. Retained holders of controlling
(1 000’s) capital premium shares ences reserves equity earnings the parent interests Total
Balance at December31, 2010 3709130 246 312 – 663 825 9 3161 10500 14390 1858 16248
Remeasurement on defi ned
benefi t pensions, net of tax – 7 – 7 – 17 – 24
Translation diff erences – 26 – 26 35 9
Net investment hedges, net of tax – 28 – 28 – 28
Cash fl ow hedges, net of tax 84 84 10 94
Available-for-sale investments,
net of tax 67 67 67
Other decrease, net – 16 – 16 – 1 – 17
Profi t – 1163 – 1163 – 324 – 1487
Total comprehensive income — — — – 54 144 — – 1179 – 1089 – 297 – 1386
Share-based compensation 18 18 18
Excess tax benefi t on
share-based compensation – 3 – 3 – 1 – 4
Settlement of performance
and restricted shares 1059 – 11 19 – 13 – 5 – 5
Contributions from shareholders 46 46 500 546
Dividend – 1484 – 1484 – 39 – 1523
Acquisitions and other change in
non-controlling interests — 15 15
Total of other equity movements — 50 19 — — – 13 – 1484 – 1428 475 – 953
Balance at December31, 2011 3710189 246 362 – 644 771 153 3148 7837 11873 2036 13909
Remeasurement on defi ned
benefi t pensions, net of tax – 127 – 127 – 79 – 206
Translation diff erences 42 42 – 2 40
Net investment hedges, net of tax – 67 – 67 – 67
Cash fl ow hedges, net of tax – 67 – 67 47 – 20
Available-for-sale investments,
net of tax 36 36 36
Other increase, net 7 7 3 10
Loss – 3105 – 3105 – 681 – 3786
Total comprehensive income — — — – 25 – 158 — – 3098 – 3281 – 712 – 3993
Share-based compensation 1 1 1
Excess tax benefi t on
share-based compensation 3 3 3
Settlement of performance
and restricted shares 796 – 5 15 – 12 – 2 – 2
Dividend – 742 – 742 – 22 – 764
Convertible bond – equity component 85 85 85
Total of other equity movements — 84 15 — — – 12 – 742 – 655 – 22 – 677
Balance at December31, 2012 3710985 246 446 – 629 746 – 5 3136 3997 7937 1302 9239