Nokia 2013 Annual Report Download - page 47
Download and view the complete annual report
Please find page 47 of the 2013 Nokia annual report below. You can navigate through the pages in the report by either clicking on the pages listed below, or by using the keyword search tool below to find specific information within the annual report.-
 1
1 -
2
-
3
-
4
-
5
-
6
-
7
-
8
-
9
-
10
-
11
-
12
-
13
-
14
-
15
-
16
-
17
-
18
-
19
-
20
-
21
-
22
-
23
-
24
-
25
-
26
-
27
-
28
-
29
-
30
-
31
-
32
-
33
-
34
-
35
-
36
-
 37
37 -
 38
38 -
 39
39 -
 40
40 -
 41
41 -
 42
42 -
 43
43 -
 44
44 -
 45
45 -
 46
46 -
 47
47 -
 48
48 -
 49
49 -
 50
50 -
 51
51 -
 52
52 -
 53
53 -
 54
54 -
 55
55 -
 56
56 -
 57
57 -
58
-
59
-
60
-
61
-
62
-
63
-
64
-
65
-
66
-
67
-
68
-
69
-
70
-
71
-
72
-
73
-
74
-
75
-
76
-
77
-
78
-
79
-
80
-
81
-
82
-
83
-
84
-
85
-
86
-
87
-
88
-
89
-
90
-
91
-
92
-
93
-
94
-
95
-
96
-
97
-
98
-
99
-
100
-
101
-
102
-
103
-
104
-
105
-
106
-
107
-
108
-
109
-
110
-
111
-
112
-
113
-
114
-
115
-
116
-
117
-
118
-
119
-
120
-
121
-
122
-
123
-
124
-
125
-
126
-
127
-
128
-
129
-
130
-
131
-
132
-
133
-
134
-
135
-
136
-
137
-
138
-
139
-
140
-
141
-
142
-
143
-
144
-
145
-
146
 |
 |

45
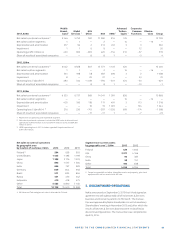
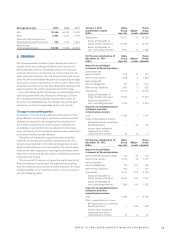
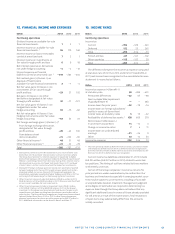
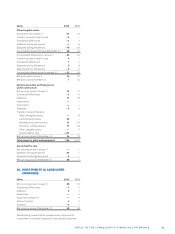
NOTES TO THE CONSOLIDATED FINANCIAL STATEMENTS
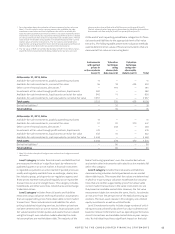
The movements in the present value of the defi ned benefi t
obligation, fair value of plan assets and the impact of minimum
Impact of Net
minimum defi ned
Presentvalue Fairvalueof funding/asset benefi t
EURm of obligation plan assets Total ceiling balance
Balance at January 1, 2012 – 1737 1657 – 80 – 2 – 82
Current service cost – 58 — – 58 — – 58
Interest expense (–)/income (+) – 89 84 – 5 — – 5
Past service cost and gains and losses on curtailments 23 — 23 — 23
Settlements 13 – 10 3 — 3
– 111 74 – 37 — – 37
Remeasurements:
Return on plan assets, excluding amounts
included in interest expense (–)/income (+) — 62 62 — 62
Gain from change in demographic assumptions — — — — —
(Loss) from change in fi nancial assumptions – 264 — – 264 — – 264
Experience (losses) – 25 — – 25 — – 25
Change in asset ceiling, excluding amounts
included in interest expense (–)/income (+) — — — – 1 – 1
– 289 62 – 227 – 1 – 228
Exchange diff erences – 7 10 3 — 3
Contributions:
Employers — 50 50 — 50
Plan participants – 14 14 — — —
Payments from plans:
Benefi t payments 68 – 50 18 — 18
Acquired in a business combination 14 – 12 2 — 2
Other movements 3 3 4 — 4
64 15 79 — 79
Balance at December, 2012 – 2073 1 808 – 265 – 3 – 268
Balance at January 1, 2013 – 2073 1808 – 265 – 3 – 268
Transfer to discontinued operations 445 – 516 – 71 — – 71
Current service cost – 44 — – 44 — – 44
Interest expense (–)/income (+) – 54 43 – 11 — – 11
Past service cost and gains and losses on curtailments 5 — 5 — 5
Settlements 12 – 8 4 — 4
– 81 35 – 46 — – 46
Remeasurements:
Return on plan assets, excluding amounts
included in interest expense (–)/income (+) — 15 15 — 15
Gain from change in demographic assumptions 4 — 4 — 4
Gain from change in fi nancial assumptions 93 — 93 — 93
Experience gains 6 — 6 — 6
Change in asset ceiling, excluding amounts
included in interest expense (–)/income (+) — — — – 4 – 4
103 15 118 – 4 114
Exchange diff erences 30 – 27 3 — 3
Contributions:
Employers — 33 33 — 33
Plan participants – 13 13 — — —
Payments from plans:
Benefi t payments 53 – 28 25 — 25
Acquired in a business combination 83 – 72 11 — 11
Other movements — — — — —
153 – 81 72 — 72
Balance at December, 2013 – 1453 1 261 – 192 – 7 – 199
funding/asset ceiling are as follows for continuing operations
in and for the entire Group in , as restated: