Nokia 2013 Annual Report Download - page 137
Download and view the complete annual report
Please find page 137 of the 2013 Nokia annual report below. You can navigate through the pages in the report by either clicking on the pages listed below, or by using the keyword search tool below to find specific information within the annual report.-
 1
1 -
2
-
3
-
4
-
5
-
6
-
7
-
8
-
9
-
10
-
11
-
12
-
13
-
14
-
15
-
16
-
17
-
18
-
19
-
20
-
21
-
22
-
23
-
24
-
25
-
26
-
27
-
28
-
29
-
30
-
31
-
32
-
33
-
34
-
35
-
36
-
37
-
38
-
39
-
40
-
41
-
42
-
43
-
44
-
45
-
46
-
47
-
48
-
49
-
50
-
51
-
52
-
53
-
54
-
55
-
56
-
57
-
58
-
59
-
60
-
61
-
62
-
63
-
64
-
65
-
66
-
67
-
68
-
69
-
70
-
71
-
72
-
73
-
74
-
75
-
76
-
77
-
78
-
79
-
80
-
81
-
82
-
83
-
84
-
85
-
86
-
87
-
88
-
89
-
90
-
91
-
92
-
93
-
94
-
95
-
96
-
97
-
98
-
99
-
100
-
101
-
102
-
103
-
104
-
105
-
106
-
107
-
108
-
109
-
110
-
111
-
112
-
113
-
114
-
115
-
116
-
117
-
118
-
119
-
120
-
121
-
122
-
123
-
124
-
125
-
126
-
 127
127 -
 128
128 -
 129
129 -
 130
130 -
 131
131 -
 132
132 -
 133
133 -
 134
134 -
 135
135 -
 136
136 -
 137
137 -
 138
138 -
 139
139 -
 140
140 -
 141
141 -
 142
142 -
 143
143 -
 144
144 -
 145
145 -
 146
146
 |
 |

135
Total intrinsicvalue of
stock options,
Number of stock December31, 2013
options 1 EUR 2
Exercise
Stock price
option per share Exer- Unexer- Exer- Unexer-
Name category Expiration date EUR cisable cisable cisable 3 cisable
Henry Tirri 2008 2Q December 31, 2013 19.16 0 0 0 0
2009 2Q December 31, 2014 11.18 12 000 0 0 0
2010 2Q December 31, 2015 8.86 16 250 3 750 0 0
2011 2Q December 27, 2017 6.02 0 27 000 0 0
2011 4Q December 27, 2017 4.84 0 168 000 0 164 640
2012 2Q December 27, 2018 2.44 0 115 000 0 388 700
2013 2Q December 27, 2019 2.71 0 220 000 0 684 200
Timo Toikkanen 2008 2Q December 31, 2013 19.16 0 0 0 0
2009 2Q December 31, 2014 11.18 12 000 0 0 0
2010 2Q December 31, 2015 8.86 20 308 4 692 0 0
2011 2Q December 27, 2017 6.02 0 27 000 0 0
2012 2Q December 27, 2018 2.44 0 28 500 0 96 330
2012 3Q December 27, 2018 2.18 0 75 000 0 273 000
2013 2Q December 27, 2019 2.71 0 350 000 0 1 088 500
Chris Weber 2011 2Q December 27, 2017 6.02 0 25 000 0 0
2012 2Q December 27, 2018 2.44 0 40 000 0 135 200
2012 3Q December 27, 2018 2.18 0 63 500 0 231 140
2013 2Q December 27, 2019 2.71 0 350 000 0 1 088 500
Juha Äkräs 2008 2Q December 31, 2013 19.16 0 0 0 0
2009 2Q December 31, 2014 11.18 12 000 0 0 0
2010 2Q December 31, 2015 8.86 32 500 7 500 0 0
2011 2Q December 27, 2017 6.02 0 45 000 0 0
2011 3Q December 27, 2017 3.76 0 150 000 0 309 000
2012 2Q December 27, 2018 2.44 0 115 000 0 388 700
2013 2Q December 27, 2019 2.71 0 250 000 0 777 500
Kai Öistämö 2008 2Q December 31, 2013 19.16 0 0 0 0
2009 2Q December 31, 2014 11.18 60 000 0 0 0
2010 2Q December 31, 2015 8.86 56 875 13 125 0 0
2011 2Q December 27, 2017 6.02 0 45 000 0 0
2011 3Q December 27, 2017 3.76 0 150 000 0 309 000
2012 2Q December 27, 2018 2.44 0 90 000 0 304 200
2013 2Q December 27, 2019 2.71 0 220 000 0 684 200
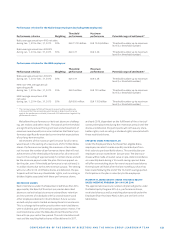
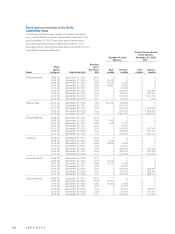
Stock options held by the members of the
Nokia Leadership Team on December31, 2013,
Total 4 791078 9480422 55176056
All outstanding stock option plans
(global plans), Total 4242 226 23660 851
COMPENSATION OF THE BOARD OF DIRECTORS AND THE NOKIA GROUP LEADERSHIP TEAM
Number of stock options equals the number of underlying shares
represented by the option entitlement. Stock options granted under
and Stock Option Plans have different vesting schedules. The
Group’s global Stock Option Plan has a vesting schedule with a %
vesting one year after grant, and quarterly vesting thereafter, each of
the quarterly lots representing .% of the total grant. The grants vest
fully in four years. The Group’s global Stock Option Plan has a vesting
schedule with % of stock options vesting three years after grant and
the remaining % vesting four years from grant.
The intrinsic value of the stock options is based on the difference
between the exercise price of the options and the closing market price
of Nokia shares on NASDAQ OMX Helsinki as at December , of
EUR..
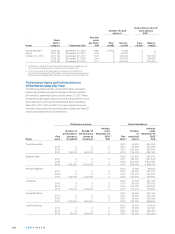
For gains realized upon exercise of stock options for the members of the
Group Executive Board, see the table in “Stock Option Exercises and Set-
tlement of Shares” below.
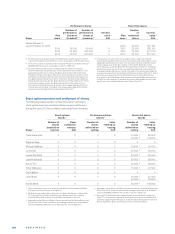
During , Marko Ahtisaari stepped down from the Nokia Leadership
Team. The information related to stock options Mr. Ahtisaari held is as of
the date of resignation from the Nokia Leadership Team and is presented
in the table below.