Nokia 2013 Annual Report Download - page 90
Download and view the complete annual report
Please find page 90 of the 2013 Nokia annual report below. You can navigate through the pages in the report by either clicking on the pages listed below, or by using the keyword search tool below to find specific information within the annual report.-
 1
1 -
2
-
3
-
4
-
5
-
6
-
7
-
8
-
9
-
10
-
11
-
12
-
13
-
14
-
15
-
16
-
17
-
18
-
19
-
20
-
21
-
22
-
23
-
24
-
25
-
26
-
27
-
28
-
29
-
30
-
31
-
32
-
33
-
34
-
35
-
36
-
37
-
38
-
39
-
40
-
41
-
42
-
43
-
44
-
45
-
46
-
47
-
48
-
49
-
50
-
51
-
52
-
53
-
54
-
55
-
56
-
57
-
58
-
59
-
60
-
61
-
62
-
63
-
64
-
65
-
66
-
67
-
68
-
69
-
70
-
71
-
72
-
73
-
74
-
75
-
76
-
77
-
78
-
79
-
 80
80 -
 81
81 -
 82
82 -
 83
83 -
 84
84 -
 85
85 -
 86
86 -
 87
87 -
 88
88 -
 89
89 -
 90
90 -
 91
91 -
 92
92 -
 93
93 -
 94
94 -
 95
95 -
 96
96 -
 97
97 -
 98
98 -
 99
99 -
 100
100 -
101
-
102
-
103
-
104
-
105
-
106
-
107
-
108
-
109
-
110
-
111
-
112
-
113
-
114
-
115
-
116
-
117
-
118
-
119
-
120
-
121
-
122
-
123
-
124
-
125
-
126
-
127
-
128
-
129
-
130
-
131
-
132
-
133
-
134
-
135
-
136
-
137
-
138
-
139
-
140
-
141
-
142
-
143
-
144
-
145
-
146
 |
 |

NOKIA IN 2013
88
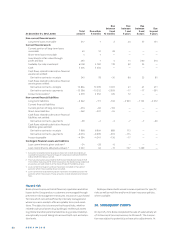
11. LEASING CONTRACTS
At December 31, 2013 the leasing contracts of the Parent
Company amounted to EUR 22 million (EUR 37 million in 2012).
EUR 8 million will expire in 2014 (EUR 12 million in 2013).
12. LOANS GRANTED TO THE MANAGEMENT
OF THE COMPANY
There were no loans granted to the members of the Group
Executive Board and Board of Directors at December , .
13. NOTES TO CASH FLOW STATEMENTS
EURm 2013 2012
Adjustments for:
Depreciation 126 164
Income taxes 23 471
Financial income and expenses – 1504 – 2694
Impairment of intangible assets 1 12
Impairment of non-current
available-for-sale investments 1277 150
Other operating income and expenses – 114 – 234
Adjustments, total – 191 – 2131
Change in net working capital
Short-term trade receivables,
increase (–), decrease (+) 1005 2190
Inventories, increase (–), decrease (+) – 25 167
Interest-free short-term liabilities,
increase (+), decrease (–) – 688 – 726
Change in net working capital 292 1631
14. PRINCIPAL NOKIA GROUP COMPANIES
ON DECEMBER 31, 2013
See note to Notes to the consolidated fi nancial statements.
15. NOKIA SHARES AND SHAREHOLDERS
See Nokia shares and shareholders p. 90–94.
16. ACCRUED INCOME
EURm 2013 2012
Taxes 7 58
Other 1931 2169
Total 1938 2227
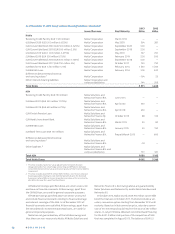
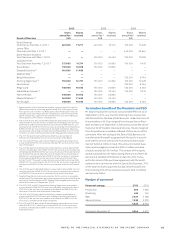
9. LONG-TERM LIABILITIES
EURm 2013 2012
Bonds 1645 3036
Convertible bond 745 743
Loans from fi nancial institutions — 500
Liabilities from Group companies 200 200
Long-term liabilities, total 2590 4479
Long-term liabilities repayable after 5 years
Bonds 1645 1749
Convertible bond — —
Loans from fi nancial institutions — —
Long-term liabilities, total 1645 1749
Bonds Million Interest, %
2009 – 2014 1250 EUR 5.534 * — 1287
2009 – 2019 1000 USD 5.572 747 805
2009 – 2019 500 EUR 6.792 545 558
2009 – 2039 500 USD 6.775 353 386
1645 3036
Convertible bond Million Interest, %
2012 – 2017 750 EUR 7.920 745 743
2013 – 2018 500 EUR 1.125 * — —
2013 – 2019 500 EUR 2.500 * — —
2013 – 2020 500 EUR 3.625 * — —
745 743
* Included in short-term liabilities.
10. COMMITMENTS AND CONTINGENCIES
EURm 2013 2012
Collateral for own commitments
Assets pledged 3 3
Contingent liabilities on behalf
of Group companies
Guarantees for loans 2 1
Leasing guarantees 143 168
Other guarantees 55 43
Contingent liabilities on behalf
of associated companies
Guarantees for loans 16 11
Contingent liabilities on behalf
of other companies
Guarantees for loans 12 12
Other guarantees 24 27