Nokia 2013 Annual Report Download - page 89
Download and view the complete annual report
Please find page 89 of the 2013 Nokia annual report below. You can navigate through the pages in the report by either clicking on the pages listed below, or by using the keyword search tool below to find specific information within the annual report.-
 1
1 -
2
-
3
-
4
-
5
-
6
-
7
-
8
-
9
-
10
-
11
-
12
-
13
-
14
-
15
-
16
-
17
-
18
-
19
-
20
-
21
-
22
-
23
-
24
-
25
-
26
-
27
-
28
-
29
-
30
-
31
-
32
-
33
-
34
-
35
-
36
-
37
-
38
-
39
-
40
-
41
-
42
-
43
-
44
-
45
-
46
-
47
-
48
-
49
-
50
-
51
-
52
-
53
-
54
-
55
-
56
-
57
-
58
-
59
-
60
-
61
-
62
-
63
-
64
-
65
-
66
-
67
-
68
-
69
-
70
-
71
-
72
-
73
-
74
-
75
-
76
-
77
-
78
-
 79
79 -
 80
80 -
 81
81 -
 82
82 -
 83
83 -
 84
84 -
 85
85 -
 86
86 -
 87
87 -
 88
88 -
 89
89 -
 90
90 -
 91
91 -
 92
92 -
 93
93 -
 94
94 -
 95
95 -
 96
96 -
 97
97 -
 98
98 -
 99
99 -
100
-
101
-
102
-
103
-
104
-
105
-
106
-
107
-
108
-
109
-
110
-
111
-
112
-
113
-
114
-
115
-
116
-
117
-
118
-
119
-
120
-
121
-
122
-
123
-
124
-
125
-
126
-
127
-
128
-
129
-
130
-
131
-
132
-
133
-
134
-
135
-
136
-
137
-
138
-
139
-
140
-
141
-
142
-
143
-
144
-
145
-
146
 |
 |

87
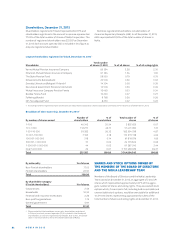
NOTES TO THE FINANCIAL STATEMENTS OF THE PARENT COMPANY
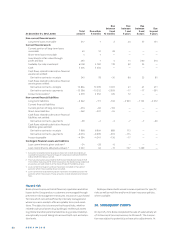
8. DISTRIBUTABLE EARNINGS
EURm 2013 2012
Reserve for invested non-restricted equity 3099 3120
Fair value reserve – 19 – 46
Retained earnings from previous years 2773 2927
Net profi t for the year – 569 – 154
Retained earnings, total 5284 5847
Treasury shares – 608 – 634
Distributable earnings, December 31 4676 5213
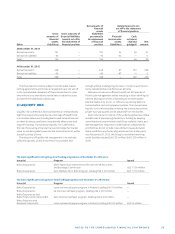
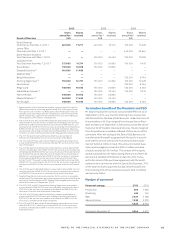
7. SHAREHOLDERS’ EQUITY
Reserve
Share for invested
Share issue Treasury Fair value non-restricted Retained
Parent Company, EURm capital premium shares reserve equity earnings Total
Balance at December 31, 2010 246 — – 669 — 3145 3612 6334
Other contribution from shareholders 46 46
Settlement of performance and restricted shares 20 – 13 7
Fair value reserve increase 68 68
Dividend – 1484 – 1484
Net profi t 1542 1542
Balance at December 31, 2011 246 46 – 649 68 3132 3670 6513
Settlement of performance and restricted shares 15 -12 3
Fair value reserve decrease – 114 – 114
Dividend – 743 – 743
Net profi t – 154 – 154
Balance at December 31, 2012 246 46 – 634 – 46 3120 2773 5505
Settlement of performance and restricted shares 26 – 21 5
Fair value reserve decrease 27 27
Dividend — —
Net profi t – 569 – 569
Balance at December 31, 2013 246 46 – 608 – 19 3099 2204 4968
NOTES TO THE FINANCIAL STATEMENTS OF THE PARENT COMPANY
6. INVESTMENTS
EURm 2013 2012
Investments in subsidiaries
Acquisition cost January 1 11548 11199
Additions 354 3127
Impairments – 1240 – 740
Disposals – 37 – 2038
Net carrying amount December 31 10625 11548
Investments in associated companies
Acquisition cost January 1 3 11
Additions — 1
Impairments — – 8
Disposals — – 1
Net carrying amount December 31 3 3
Investments in other shares
Acquisition cost January 1 105 85
Additions 7 23
Impairments — – 2
Disposals – 4 – 1
Net carrying amount December 31 108 105