Nokia 2013 Annual Report Download - page 51
Download and view the complete annual report
Please find page 51 of the 2013 Nokia annual report below. You can navigate through the pages in the report by either clicking on the pages listed below, or by using the keyword search tool below to find specific information within the annual report.-
 1
1 -
2
-
3
-
4
-
5
-
6
-
7
-
8
-
9
-
10
-
11
-
12
-
13
-
14
-
15
-
16
-
17
-
18
-
19
-
20
-
21
-
22
-
23
-
24
-
25
-
26
-
27
-
28
-
29
-
30
-
31
-
32
-
33
-
34
-
35
-
36
-
37
-
38
-
39
-
40
-
 41
41 -
 42
42 -
 43
43 -
 44
44 -
 45
45 -
 46
46 -
 47
47 -
 48
48 -
 49
49 -
 50
50 -
 51
51 -
 52
52 -
 53
53 -
 54
54 -
 55
55 -
 56
56 -
 57
57 -
 58
58 -
 59
59 -
 60
60 -
 61
61 -
62
-
63
-
64
-
65
-
66
-
67
-
68
-
69
-
70
-
71
-
72
-
73
-
74
-
75
-
76
-
77
-
78
-
79
-
80
-
81
-
82
-
83
-
84
-
85
-
86
-
87
-
88
-
89
-
90
-
91
-
92
-
93
-
94
-
95
-
96
-
97
-
98
-
99
-
100
-
101
-
102
-
103
-
104
-
105
-
106
-
107
-
108
-
109
-
110
-
111
-
112
-
113
-
114
-
115
-
116
-
117
-
118
-
119
-
120
-
121
-
122
-
123
-
124
-
125
-
126
-
127
-
128
-
129
-
130
-
131
-
132
-
133
-
134
-
135
-
136
-
137
-
138
-
139
-
140
-
141
-
142
-
143
-
144
-
145
-
146
 |
 |

49
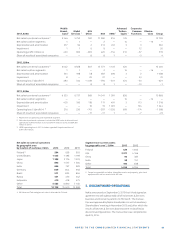
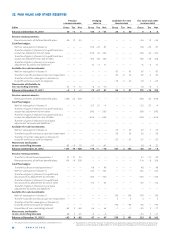
NOTES TO THE CONSOLIDATED FINANCIAL STATEMENTS
EURm 2013 2012 2011
Smart Devices 1 — 899 862
Mobile Phones 1 — 530 502
Devices& Services
(discontinued operations) 1 1 417 — —
HERE 3 219 3 270 3 274
Radio Access Networks
in Mobile Broadband 2 88 — —
Global Services 2 91 — —
NSN 2 — 183 173
Total 4815 4882 4811
Smart Devices and Mobile Phones CGUs have been combined to a single
Devices & Services CGU in .
NSN has two groups of CGUs to which goodwill has been allocated in .
The recoverable values of the Smart Devices and Mobile
Phones CGUs, were previously valued on a value in use basis.
Value in use was based on reasonable and supportable as-
sumptions that represented management’s best estimate of
the economic circumstances that will prevail over the remain-
ing life of an asset (“steady state”). During , the Devices
& Services CGU recoverable value was estimated based on the
fair value less cost of disposal based on the agreed purchase
price defi ned for the Sale of the D&S business, excluding any
consideration attributable to patents or patent applications.
The recoverable amounts for the HERE CGU, Radio Access
Networks and Global Services group of CGUs are based on
fair value less cost of disposal and were EUR million, EUR
million and EUR million, respectively, at the date
of the annual impairment testing. The valuation meth-
odologies have remained consistent from previous years. Fair
value less cost of disposal was estimated using a discounted
cash fl ow calculation. The cash fl ow projections employed in
the discounted cash fl ow calculation have been determined by
management based on the information available to refl ect the
amount that an entity could obtain from separate disposal of
each of the CGUs, in an orderly transaction between market
participants at the measurement date after deducting the
estimated costs of disposal. The estimates of fair value less
cost of disposal are categorized in the level of the fair value
hierarchy.
Discounted cash fl ows for the NSN groups of CGUs and HERE
CGU were modeled over ten annual periods. The growth rates
used in transitioning to terminal year refl ect estimated long-
term stable growth which do not exceed long-term average
growth rates for the industry and economies in which the CGUs
operate. All cash fl ow projections are consistent with external
sources of information, wherever possible.
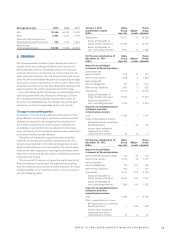
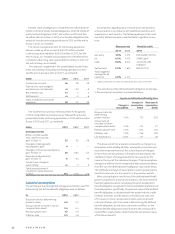
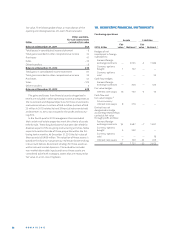
The key assumptions applied in the impairment test-
ing analysis for each CGU are presented in the table below.
No information has been included for the Devices & Services
CGU as the recoverable amount was not determined using a
discounted cash fl ow analysis and the CGU is attributable to
discontinued operations:
Cash-generating unit
RadioAccess Global
Networksgroup Services
ofCGUsinMobile group
HERE Broadband
1 ofCGUs 1 NSN
% 2013 2012 2013 2012 2013 2012 2013 2012
Terminal growth rate 1.7 1.7 1.5 — 0.5 — — 0.7
Post-tax discount rate 10.6 9.9 10.8 — 10.1 — — 10.3
NSN CGU is divided into two groups of CGUs in : Radio Access Net-
works group of CGUs within the Mobile Broadband operating segment and
the Global Services group of CGUs.
Fair value less cost of disposal for the HERE CGU and Radio
Access Networks and Global Services group of CGUs are
determined using post-tax valuation assumptions including
projected cash fl ows and the discount rate.
The discount rates applied in the impairment testing for the
above noted CGUs or groups of CGUs refl ect current assess-
ments of the time value of money and relevant market risk
premiums. Risk premiums included in the determination of
the discount rate refl ect risks and uncertainties for which the
future cash fl ow estimates have not been adjusted.
In the fourth quarter of the Group recorded an impair-
ment loss of EUR million to reduce the carrying amount
of the HERE CGU to its recoverable amount at that time. The
impairment loss was allocated in its entirety to the carrying
amount of goodwill. The Group’s goodwill impairment test-
ing did not result in impairment charges for the years ended
December, or .
The recoverable amount of the HERE CGU exceeds its carry-
ing amount by a small margin at the testing date. The related
valuation is deemed most sensitive to the changes in both
discount and long-term growth rates. A discount rate increase
in excess of . percentage point or long-term growth decline
in excess of . percentage point would result in impairment
loss in the HERE CGU. Management’s estimates of the overall
automotive volumes and market share, customer adoption of
the new location-based platform and related service off er-
ings, projected value of the services sold to Microsoft and
assumptions regarding pricing as well as continued focus on
cost effi ciency are the main drivers for the HERE net cash fl ow
projections. The Group’s cash fl ow forecasts refl ect the cur-
rent strategic views that license fee based models will remain
important in both near and long term. Management expects
that license fee based models which are augmented with soft-
ware and services and monetized via license fees, transactions