Nokia 2013 Annual Report Download - page 12
Download and view the complete annual report
Please find page 12 of the 2013 Nokia annual report below. You can navigate through the pages in the report by either clicking on the pages listed below, or by using the keyword search tool below to find specific information within the annual report.-
 1
1 -
 2
2 -
 3
3 -
 4
4 -
 5
5 -
 6
6 -
 7
7 -
 8
8 -
 9
9 -
 10
10 -
 11
11 -
 12
12 -
 13
13 -
 14
14 -
 15
15 -
 16
16 -
 17
17 -
 18
18 -
 19
19 -
 20
20 -
 21
21 -
 22
22 -
23
-
24
-
25
-
26
-
27
-
28
-
29
-
30
-
31
-
32
-
33
-
34
-
35
-
36
-
37
-
38
-
39
-
40
-
41
-
42
-
43
-
44
-
45
-
46
-
47
-
48
-
49
-
50
-
51
-
52
-
53
-
54
-
55
-
56
-
57
-
58
-
59
-
60
-
61
-
62
-
63
-
64
-
65
-
66
-
67
-
68
-
69
-
70
-
71
-
72
-
73
-
74
-
75
-
76
-
77
-
78
-
79
-
80
-
81
-
82
-
83
-
84
-
85
-
86
-
87
-
88
-
89
-
90
-
91
-
92
-
93
-
94
-
95
-
96
-
97
-
98
-
99
-
100
-
101
-
102
-
103
-
104
-
105
-
106
-
107
-
108
-
109
-
110
-
111
-
112
-
113
-
114
-
115
-
116
-
117
-
118
-
119
-
120
-
121
-
122
-
123
-
124
-
125
-
126
-
127
-
128
-
129
-
130
-
131
-
132
-
133
-
134
-
135
-
136
-
137
-
138
-
139
-
140
-
141
-
142
-
143
-
144
-
145
-
146
 |
 |

NOKIA IN 2013
10
to the exiting of certain customer contracts and countries as
part of NSN’s strategy to focus on more profi table business as
well as a decline in network roll-outs in Japan and Europe.
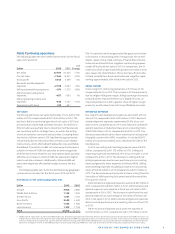
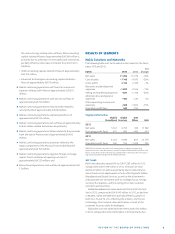
The following table sets forth the distribution by geographi-
cal area of our net sales for the fi scal years and .
NSN net sales by geographic area
YoY
EURm 2013 2012 Change
Europe 3 041 3 896 – 22%
Middle East & Africa 1 111 1 287 – 14%
Greater China 1 185 1 278 – 7%
Asia–Pacifi c 3 354 4 347 – 23%
North America 1 334 1 294 3%
Latin America 1 257 1 677 – 25%
Total 11 282 13 779 – 18%
GROSS MARGIN
NSN’s gross margin was .% in , compared to .%
in , driven by improved effi ciency in Global Services, an
improved product mix with a greater share of higher margin
products, and the divestment of less profi table businesses.
In Mobile Broadband, gross margin improved in driven
by an increased software share in the product mix, off set by
costs incurred in anticipation of a technology shift to TD-LTE.
In Global Services, gross margin improved signifi cantly in
due to the increase in effi ciencies as part of our restruc-
turing program and the exit of certain customer contracts and
countries as part of NSN’s strategy to focus on more profi table
business.
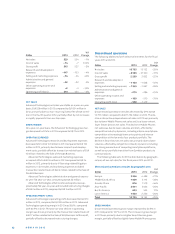
OPERATING EXPENSES
NSN’s research and development expenses decreased %
year-on-year in to EUR million from EUR million
in , primarily due to business divestments and reduced
investment in business activities not in line with NSN’s focused
strategy as well as increased research and development ef-
fi ciency, partially off set by higher investments in business
activities that are in line with NSN’s focused strategy, most
notably LTE.
NSN’s sales and marketing expenses decreased % year-
on-year in to EUR million from EUR million in ,
primarily due to structural cost savings from NSN’s restruc-
turing program and a decrease in purchase price accounting
related items arising from the formation of NSN, which were
fully amortized at the end of the fi rst quarter of .
NSN’s administrative and general expenses increased %
year-on-year in to EUR million from EUR million in
, primarily due to consultancy fees related to fi nance and
information technology related projects, partially off set by
structural cost savings.
NSN’s other income and expenses decreased in to
an expense of EUR million from an expense of EUR
million in . In other income and expenses included
restructuring charges of EUR million, including EUR mil-
lion related to country and contract exits and EUR million
related to divestments to businesses, and in included
restructuring charges and associated charges of EUR mil-
lion, including EUR million related to country and contract
exits, divestment of businesses EUR million, impairments of
assets of EUR million, a negative adjustment of EUR million
to purchase price allocations related to the fi nal payment from
Motorola, as well as amortization of acquired intangible assets
of EUR million.
OPERATING PROFIT (LOSS)
NSN’s operating profi t in was EUR million, compared
with an operating loss of EUR million in . NSN’s operat-
ing margin in was .%, compared with a negative .% in
. The increase in operating profi t was primarily a result of
an increase in the contribution of Global Services and a reduc-
tion in costs associated with NSN’s transformation, consisting
mainly of restructuring charges. Further, the purchase price
accounting related items arising from the formation of NSN,
which were fully amortized at the end of the fi rst quarter of
.
The contribution of Mobile Broadband declined from EUR
million in to EUR million in , primarily as a
result of lower net sales, which was partially off set by an im-
proved gross margin and a reduction in operating expenses.
The contribution of Global Services increased from EUR
million in to EUR million in , as the increase in
gross margin more than compensated for the decline in net
sales, and the contribution in was further supported by a
reduction in operating expenses.
STRATEGY AND RESTRUCTURING PROGRAM
In November , NSN announced its strategy to focus on
mobile broadband and services, and also launched an exten-
sive global restructuring program, targeting the reduction of
its annualized operating expenses and production overhead,
excluding special items and purchase price accounting related
items, by EUR billion by the end of , compared to the end
of . In January , this target was raised to EUR . billion,
and in July this target was further raised to “more than
EUR . billion”. While these savings were expected to come
largely from organizational streamlining, the program also
targeted areas such as real estate, information technology,
product and service procurement costs, overall general and
administrative expenses, and a signifi cant reduction of suppli-
ers in order to further lower costs and improve quality. In ,
NSN achieved its target to reduce operating expenses and
production overhead, excluding special items and purchase