Nokia 2013 Annual Report Download - page 56
Download and view the complete annual report
Please find page 56 of the 2013 Nokia annual report below. You can navigate through the pages in the report by either clicking on the pages listed below, or by using the keyword search tool below to find specific information within the annual report.-
 1
1 -
2
-
3
-
4
-
5
-
6
-
7
-
8
-
9
-
10
-
11
-
12
-
13
-
14
-
15
-
16
-
17
-
18
-
19
-
20
-
21
-
22
-
23
-
24
-
25
-
26
-
27
-
28
-
29
-
30
-
31
-
32
-
33
-
34
-
35
-
36
-
37
-
38
-
39
-
40
-
41
-
42
-
43
-
44
-
45
-
 46
46 -
 47
47 -
 48
48 -
 49
49 -
 50
50 -
 51
51 -
 52
52 -
 53
53 -
 54
54 -
 55
55 -
 56
56 -
 57
57 -
 58
58 -
 59
59 -
 60
60 -
 61
61 -
 62
62 -
 63
63 -
 64
64 -
 65
65 -
 66
66 -
67
-
68
-
69
-
70
-
71
-
72
-
73
-
74
-
75
-
76
-
77
-
78
-
79
-
80
-
81
-
82
-
83
-
84
-
85
-
86
-
87
-
88
-
89
-
90
-
91
-
92
-
93
-
94
-
95
-
96
-
97
-
98
-
99
-
100
-
101
-
102
-
103
-
104
-
105
-
106
-
107
-
108
-
109
-
110
-
111
-
112
-
113
-
114
-
115
-
116
-
117
-
118
-
119
-
120
-
121
-
122
-
123
-
124
-
125
-
126
-
127
-
128
-
129
-
130
-
131
-
132
-
133
-
134
-
135
-
136
-
137
-
138
-
139
-
140
-
141
-
142
-
143
-
144
-
145
-
146
 |
 |

NOKIA IN 2013
54
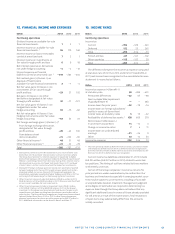
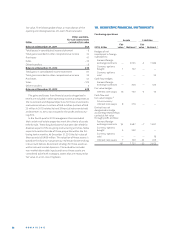
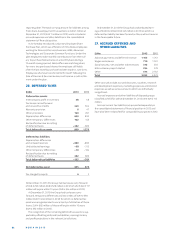
17. FAIR VALUE OF FINANCIAL INSTRUMENTS
Carrying amounts
Financial
instruments
Current Non-current at fair Loans and Financial
available- available- value receivables liabilities
for-sale for-sale through measuredat measuredat Total
fi nancial fi nancial profi t amortized amortized carrying Fair
Continuing operations assets assets or loss cost cost amounts value 1
At December31, 2013, EURm
Available-for-sale investments,
publicly quoted equity shares — 11 — — — 11 11
Available-for-sale investments, carried at fair value — 503 — — — 503 503
Available-for-sale investments,
carried at cost less impairment — 227 — — — 227 227
Long-term loans receivable — — — 96 — 96 85
Accounts receivable — — — 2901 — 2 901 2 901
Current portion of long-term loans receivable — — — 29 — 29 29
Other current fi nancial assets, derivatives — — 191 — — 191 191
Other current fi nancial assets, other — — — 94 — 94 94
Investments at fair value through profi t and loss,
liquid assets — — 382 — — 382 382
Available-for-sale investments,
liquid assets carried at fair value 956 — — — — 956 956
Available-for-sale investments,
cash equivalents carried at fair value 3957 — — — — 3 957 3 957
Total fi nancial assets 4 913 741 573 3120 — 9347 9336
Long-term interest-bearing liabilities 2 — — — — 3 286 3 286 4 521
Current portion of long-term loans payable 2 — — — — 3 192 3 192 3 385
Short-term borrowing — — — — 184 184 184
Other fi nancial liabilities — — 35 — — 35 35
Accounts payable — — — — 1 842 1 842 1 842
Total fi nancial liabilities — — 35 — 8504 8539 9967
At December31, 2012, EURm
Available-for-sale investments,
publicly quoted equity shares — 11 — — — 11 11
Available-for-sale investments, carried at fair value — 447 — — — 447 447
Available-for-sale investments,
carried at cost less impairment — 231 — — — 231 231
Long-term loans receivable — — — 125 — 125 113
Accounts receivable — — — 5 551 — 5 551 5 551
Current portion of long-term loans receivable — — — 35 — 35 35
Other current fi nancial assets, derivatives — — 448 — — 448 448
Other current fi nancial assets, other — — — 3 — 3 3
Investments at fair value through profi t and loss,
liquid assets — — 415 — — 415 415
Available-for-sale investments,
liquid assets carried at fair value 542 — — — — 542 542
Available for-sale investments,
cash equivalents carried at fair value 5 448 — — — — 5 448 5 448
Total fi nancial assets 5990 689 863 5714 — 13 256 13 244
Long-term interest-bearing liabilities 2 — — — — 5 087 5 087 5 298
Current portion of long-term loans payable 2 — — — — 201 201 201
Short-term borrowing — — — — 261 261 261
Other fi nancial liabilities — — 90 — — 90 90
Accounts payable — — — — 4 394 4 394 4 394
Total fi nancial liabilities — — 90 — 9943 10033 10244