Nokia 2013 Annual Report Download - page 25
Download and view the complete annual report
Please find page 25 of the 2013 Nokia annual report below. You can navigate through the pages in the report by either clicking on the pages listed below, or by using the keyword search tool below to find specific information within the annual report.-
 1
1 -
2
-
3
-
4
-
5
-
6
-
7
-
8
-
9
-
10
-
11
-
12
-
13
-
14
-
 15
15 -
 16
16 -
 17
17 -
 18
18 -
 19
19 -
 20
20 -
 21
21 -
 22
22 -
 23
23 -
 24
24 -
 25
25 -
 26
26 -
 27
27 -
 28
28 -
 29
29 -
 30
30 -
 31
31 -
 32
32 -
 33
33 -
 34
34 -
 35
35 -
36
-
37
-
38
-
39
-
40
-
41
-
42
-
43
-
44
-
45
-
46
-
47
-
48
-
49
-
50
-
51
-
52
-
53
-
54
-
55
-
56
-
57
-
58
-
59
-
60
-
61
-
62
-
63
-
64
-
65
-
66
-
67
-
68
-
69
-
70
-
71
-
72
-
73
-
74
-
75
-
76
-
77
-
78
-
79
-
80
-
81
-
82
-
83
-
84
-
85
-
86
-
87
-
88
-
89
-
90
-
91
-
92
-
93
-
94
-
95
-
96
-
97
-
98
-
99
-
100
-
101
-
102
-
103
-
104
-
105
-
106
-
107
-
108
-
109
-
110
-
111
-
112
-
113
-
114
-
115
-
116
-
117
-
118
-
119
-
120
-
121
-
122
-
123
-
124
-
125
-
126
-
127
-
128
-
129
-
130
-
131
-
132
-
133
-
134
-
135
-
136
-
137
-
138
-
139
-
140
-
141
-
142
-
143
-
144
-
145
-
146
 |
 |

23
NOKIA CORPORATION AND SUBSIDIARIES
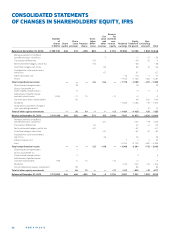
CONSOLIDATED STATEMENTS
OF COMPREHENSIVE INCOME, IFRS
2013
FinancialyearendedDecember31 Notes EURm EURm EURm
Loss – 739 – 3786 – 1487
Other comprehensive income (+)/expence (–)
Items that will not be reclassifi ed to profi t or loss
Remeasurements on defi ned benefi t pensions 6 83 – 228 – 36
Items that may be reclassifi ed subsequently to profi t or loss
Translation diff erences 23 – 496 41 9
Net investment hedges 23 114 – 58 – 37
Cash fl ow hedges 22 3 – 41 116
Available-for-sale investments 22 49 35 70
Other increase (+)/decrease (–), net 5 10 – 17
Income tax related to components of other
comprehensive expense (–)/income (+) 22,23 – 2 34 – 4
Other comprehensive expense (–)/income (+), net of tax – 244 – 207 101
Total comprehensive expense – 983 – 3993 – 1386
Total comprehensive expense
attributable to
equity holders of the parent – 863 – 3281 – 1089
non-controlling interests – 120 – 712 – 297
– 983 – 3993 – 1386
Total comprehensive income(+)/expense (–) attributable
to equity holders of the parent arises from:
Continuing operations 34 – 831 – 1 200
Discontinued operations – 897 – 2 450 111
– 863 – 3 281 – 1 089
* Full years and reflect the retrospective application of Revised IAS , Employee Benefits.
See Notes to Consolidated Financial Statements.
2012 * 2011 *