Nokia 2013 Annual Report Download - page 100
Download and view the complete annual report
Please find page 100 of the 2013 Nokia annual report below. You can navigate through the pages in the report by either clicking on the pages listed below, or by using the keyword search tool below to find specific information within the annual report.-
 1
1 -
2
-
3
-
4
-
5
-
6
-
7
-
8
-
9
-
10
-
11
-
12
-
13
-
14
-
15
-
16
-
17
-
18
-
19
-
20
-
21
-
22
-
23
-
24
-
25
-
26
-
27
-
28
-
29
-
30
-
31
-
32
-
33
-
34
-
35
-
36
-
37
-
38
-
39
-
40
-
41
-
42
-
43
-
44
-
45
-
46
-
47
-
48
-
49
-
50
-
51
-
52
-
53
-
54
-
55
-
56
-
57
-
58
-
59
-
60
-
61
-
62
-
63
-
64
-
65
-
66
-
67
-
68
-
69
-
70
-
71
-
72
-
73
-
74
-
75
-
76
-
77
-
78
-
79
-
80
-
81
-
82
-
83
-
84
-
85
-
86
-
87
-
88
-
89
-
 90
90 -
 91
91 -
 92
92 -
 93
93 -
 94
94 -
 95
95 -
 96
96 -
 97
97 -
 98
98 -
 99
99 -
 100
100 -
 101
101 -
 102
102 -
 103
103 -
 104
104 -
 105
105 -
 106
106 -
 107
107 -
 108
108 -
 109
109 -
 110
110 -
111
-
112
-
113
-
114
-
115
-
116
-
117
-
118
-
119
-
120
-
121
-
122
-
123
-
124
-
125
-
126
-
127
-
128
-
129
-
130
-
131
-
132
-
133
-
134
-
135
-
136
-
137
-
138
-
139
-
140
-
141
-
142
-
143
-
144
-
145
-
146
 |
 |

NOKIA IN 2013
98
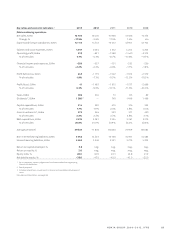
KEY RATIOS UNDER IFRS
Operating profi t
Profi t after depreciation
Shareholders’ equity
Share capital + reserves attributable to the Company’s equity
holders
Earnings per share (basic)
Profi t attributable to equity holders of the parent
Average of adjusted number of shares during the year
P/E ratio
Adjusted share price, December
Earnings per share
Dividend per share
Nominal dividend per share
The adjustment coeffi cients of the share issues that have
taken place during or after the year in question
Payout ratio
Dividend per share
Earnings per share
Dividend yield, %
Nominal dividend per share
Share price
Shareholders’ equity per share
Capital and reserves attributable to
the Company’s equity holders
Adjusted number of shares at year end
Market capitalization
Number of shares x share price per share class
Adjusted average share price
Amount traded, in EUR, during the period
Adjusted number of shares traded during the period
Share turnover, %
Number of shares traded during the period
Average number of shares during the period
Return on capital employed, %
Profi t before taxes + interest and other net fi nancial expenses
Average capital and reserves attributable to the Company’s
equity holders + short-term borrowings
+ long-term interest-bearing liabilities
(including the current portion thereof)
+ non-controlling interests
Return on shareholders’ equity, %
Profi t attributable to the equity holders of the parent
Average capital and reserves attributable to the Company’s
equity holders during the year
Equity ratio, %
Capital and reserves attributable to the Company’s equity
holders + non-controlling interests
Total assets – advance payments received
Net debt to equity (gearing), %
Long-term interest-bearing liabilities
(including the current portion thereof)
+ short-term borrowings – cash and other liquid assets
Capital and reserves attributable to the equity holders of the
parent + non-controlling interests
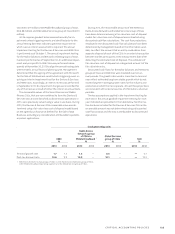
Year-end currency rates
1
EUR =
USD 1.3751
GBP 0.8444
CNY 8.3498
INR 85.1620
RUB 45.2264
JPY 141.80
CALCULATION OF KEY RATIOS