Nokia 2013 Annual Report Download - page 84
Download and view the complete annual report
Please find page 84 of the 2013 Nokia annual report below. You can navigate through the pages in the report by either clicking on the pages listed below, or by using the keyword search tool below to find specific information within the annual report.-
 1
1 -
2
-
3
-
4
-
5
-
6
-
7
-
8
-
9
-
10
-
11
-
12
-
13
-
14
-
15
-
16
-
17
-
18
-
19
-
20
-
21
-
22
-
23
-
24
-
25
-
26
-
27
-
28
-
29
-
30
-
31
-
32
-
33
-
34
-
35
-
36
-
37
-
38
-
39
-
40
-
41
-
42
-
43
-
44
-
45
-
46
-
47
-
48
-
49
-
50
-
51
-
52
-
53
-
54
-
55
-
56
-
57
-
58
-
59
-
60
-
61
-
62
-
63
-
64
-
65
-
66
-
67
-
68
-
69
-
70
-
71
-
72
-
73
-
 74
74 -
 75
75 -
 76
76 -
 77
77 -
 78
78 -
 79
79 -
 80
80 -
 81
81 -
 82
82 -
 83
83 -
 84
84 -
 85
85 -
 86
86 -
 87
87 -
 88
88 -
 89
89 -
 90
90 -
 91
91 -
 92
92 -
 93
93 -
 94
94 -
95
-
96
-
97
-
98
-
99
-
100
-
101
-
102
-
103
-
104
-
105
-
106
-
107
-
108
-
109
-
110
-
111
-
112
-
113
-
114
-
115
-
116
-
117
-
118
-
119
-
120
-
121
-
122
-
123
-
124
-
125
-
126
-
127
-
128
-
129
-
130
-
131
-
132
-
133
-
134
-
135
-
136
-
137
-
138
-
139
-
140
-
141
-
142
-
143
-
144
-
145
-
146
 |
 |

NOKIA IN 2013
82
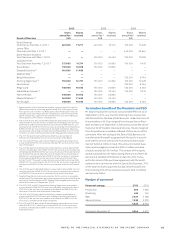
INCOME STATEMENTS, PARENT COMPANY, FAS
PARENT COMPANY FINANCIAL STATEMENTS
ACCORDING TO FINNISH ACCOUNTING STANDARDS
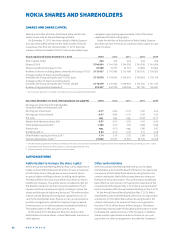
BALANCE SHEETS, PARENT COMPANY, FAS
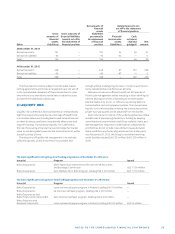
Financial year ended 2013 2012
December 31 Notes EURm EURm
Net sales 11177 11727
Cost of sales – 9865 – 10198
Gross profi t 1312 1529
Selling and marketing expenses – 668 – 1141
Research and development expenses – 1516 – 2298
Administrative expenses – 94 – 133
Other operating expenses – 39 – 119
Other operating income 65 1136
Operating profi t 2, 3 – 940 – 1026
Financial income and expenses
Income from long-term investments
Dividend income from Group companies 1720 2168
Dividend income from other companies — 7
Interest income from other companies 6 2
Other interest and fi nancial income
Interest income from Group companies 9 11
Interest income from other companies 7 1
Other fi nancial income
from other companies 11 7
Exchange gains and losses – 17 – 147
Interest expenses and other
fi nancial expenses
Interest expenses to Group companies – 2 – 14
Interest expenses to other companies – 233 – 115
Impairment loss on investments
in subsidiaries – 1240 – 750
Other fi nancial expenses 58 – 31
Financial income and expenses, total 319 1139
Profi t before extraordinary items
and taxes – 621 113
Extraordinary items
Group contributions 75 204
Extraordinary items, total 75 204
Profi t before taxes – 546 317
Income taxes
for the year 18 – 61 – 56
from previous years 38 60
deferred taxes 19 — – 475
Net profi t – 569 – 154
See Notes to the financial statements of the parent company.
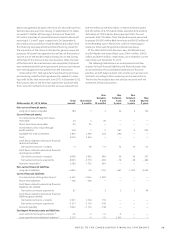
2013 2012
December 31 Notes EURm EURm
ASSETS
Fixed assets and other non-current assets
Intangible assets 4
Intangible rights 7 14
Other intangible assets 50 165
57 179
Tangible assets
Machinery and equipment 5 — 2
— 2
Investments
Investments in subsidiaries 6 10625 11548
Investments in associated
companies 6 3 3
Long-term loan receivables
from Group companies — —
Long-term loan receivables
from other companies 53 48
Other non-current assets 6 108 105
10789 11704
Current assets
Inventories and work in progress
Raw materials and supplies 3 1
Work in progress 24 6
Finished goods 55 50
82 57
Receivables
Deferred tax assets — —
Trade debtors from Group companies 775 673
Trade debtors from other companies 61 132
Short-term loan receivables
from Group companies 2020 2938
Prepaid expenses and accrued income
from Group companies 714 724
Prepaid expenses and accrued income
from other companies 1224 1503
4794 5970
Short-term investments 5 40
Bank and cash 31 37
Total 15759 17989
See Notes to the financial statements of the parent company.