Nokia 2013 Annual Report Download - page 11
Download and view the complete annual report
Please find page 11 of the 2013 Nokia annual report below. You can navigate through the pages in the report by either clicking on the pages listed below, or by using the keyword search tool below to find specific information within the annual report.-
 1
1 -
 2
2 -
 3
3 -
 4
4 -
 5
5 -
 6
6 -
 7
7 -
 8
8 -
 9
9 -
 10
10 -
 11
11 -
 12
12 -
 13
13 -
 14
14 -
 15
15 -
 16
16 -
 17
17 -
 18
18 -
 19
19 -
 20
20 -
 21
21 -
 22
22 -
23
-
24
-
25
-
26
-
27
-
28
-
29
-
30
-
31
-
32
-
33
-
34
-
35
-
36
-
37
-
38
-
39
-
40
-
41
-
42
-
43
-
44
-
45
-
46
-
47
-
48
-
49
-
50
-
51
-
52
-
53
-
54
-
55
-
56
-
57
-
58
-
59
-
60
-
61
-
62
-
63
-
64
-
65
-
66
-
67
-
68
-
69
-
70
-
71
-
72
-
73
-
74
-
75
-
76
-
77
-
78
-
79
-
80
-
81
-
82
-
83
-
84
-
85
-
86
-
87
-
88
-
89
-
90
-
91
-
92
-
93
-
94
-
95
-
96
-
97
-
98
-
99
-
100
-
101
-
102
-
103
-
104
-
105
-
106
-
107
-
108
-
109
-
110
-
111
-
112
-
113
-
114
-
115
-
116
-
117
-
118
-
119
-
120
-
121
-
122
-
123
-
124
-
125
-
126
-
127
-
128
-
129
-
130
-
131
-
132
-
133
-
134
-
135
-
136
-
137
-
138
-
139
-
140
-
141
-
142
-
143
-
144
-
145
-
146
 |
 |

REVIEW BY THE BOARD OF DIRECTORS 9
the restructuring-related cash outfl ows, NSN net working
capital-related infl ows of approximately EUR million is
primarily due to a decrease in receivables and inventories,
partially off set by a decrease in interest free short term
liabilities.
▪ HERE net working capital-related infl ows of approximately
EUR million;
▪ Advanced Technologies net working capital-related in-
fl ows of approximately EUR million.
■ Nokia’s continuing operations net fi nancial income and
expense-related cash infl ow of approximately EUR
million,
■ Nokia’s continuing operations cash tax net outfl ows of
approximately EUR million;
■ Nokia’s continuing operations net proceeds related to
unlisted funds of approximately EUR million;
■ Nokia’s continuing operations capital expenditure of
approximately EUR million;
■ Nokia’s continuing operations net outfl ows of approximately
EUR million related to business divestments;
■ Nokia’s continuing operations infl ow related to the proceeds
from the sale of fi xed assets of approximately EUR
million;
■ Nokia’s continuing operations proceeds related to the
equity component of the Microsoft convertible bond of
approximately EUR million;
■ Nokia’s continuing operations negative foreign exchange
impact from translation of opening net cash of
approximately EUR million; and
■ Discontinued operations cash outfl ow of approximately EUR
. billion.
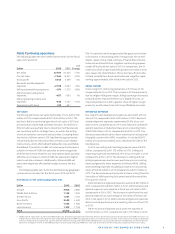
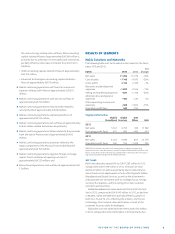
RESULTS BY SEGMENTS
Nokia Solutions and Networks
The following table sets forth selective line items for the fi scal
years and .
YoY
EURm 2013 2012 Change
Net sales 11 282 13 779 – 18%
Cost of sales – 7 148 – 9 610 – 26%
Gross profi t 4 134 4 169 – 1%
Research and development
expenses – 1 822 – 2 046 – 11%
Selling and marketing expenses – 821 – 1 158 – 29%
Administrative and general
expenses – 489 – 470 4%
Other operating income and
expenses – 582 – 1 290 – 55%
Operating profi t/loss 420 – 795
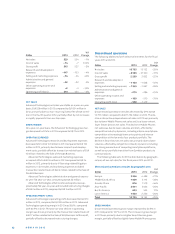
Segment information
Mobile Global NSN
Broadband Services Other NSN
2013
Net sales 5 347 5 753 182 11 282
Operating profi t (loss) 420 693 – 693 420
2012
Net sales 6 043 6 929 807 13 779
Operating profi t (loss) 490 334 – 1 619 – 795
NSN Other includes net sales and related cost of sales and operating
expenses of non-core businesses, as well as Optical Networks business until
May , when its divestment was completed. It also includes restructur-
ing and associated charges for the NSN business.
NET SALES
NSN’s net sales decreased % to EUR million in ,
compared to EUR million in . The year-on-year
decline in NSN’s net sales was primarily due to reduced wire-
less infrastructure deployment activity aff ecting both Mobile
Broadband and Global Services, as well as the divestments
of businesses not consistent with its strategic focus, foreign
currency fl uctuations, and the exiting of certain customer
contracts and countries.
Mobile Broadband net sales declined % to EUR mil-
lion in , compared to EUR million in , as declines
in WCDMA, CDMA and GSM were partially off set by growth in
both FD-LTE and TD-LTE, refl ecting the industry shift to G
technology. Core network sales declined as a result of the
customer focus on radio technologies.
Global Services net sales declined % to EUR million
in , compared to EUR million in primarily due