Nokia 2013 Annual Report Download - page 88
Download and view the complete annual report
Please find page 88 of the 2013 Nokia annual report below. You can navigate through the pages in the report by either clicking on the pages listed below, or by using the keyword search tool below to find specific information within the annual report.
NOKIA IN 2013
86
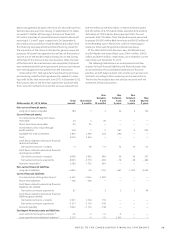
3. DEPRECIATION AND AMORTIZATION
EURm 2013 2012
Depreciation and amortization
by asset class category
Intangible assets
Capitalized development costs — —
Intangible rights 11 19
Other intangible assets 114 143
Tangible assets 1 2
Total 126 164
Depreciation and amortization
by function
R&D 115 145
Production 1 3
Selling, marketing and administration 10 16
Total 126 164
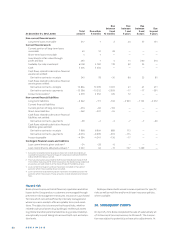
4. INTANGIBLE ASSETS
EURm 2013 2012
Capitalized development costs
Acquisition cost January 1 284 284
Disposals during the period — —
Accumulated acquisition cost December 31 284 284
Accumulated amortization January 1 – 284 – 284
Disposals during the period — —
Amortization during the period — —
Accumulated amortization December 31 – 284 – 284
Net book value January 1 — —
Net book value December 31 — —
Intangible rights
Acquisition cost January 1 228 251
Additions during the period 4 4
Disposals during the period – 75 – 27
Accumulated acquisition cost December 31 157 228
Accumulated amortization January 1 – 214 – 215
Disposals during the period 75 20
Amortization during the period – 11 – 19
Accumulated amortization December 31 – 150 – 214
Net book value January 1 14 36
Net book value December 31 7 14
Other intangible assets
Acquisition cost January 1 753 782
Additions during the period — 2
Disposals during the period – 2 – 31
Accumulated acquisition cost December 31 751 753
Accumulated amortization January 1 – 587 – 463
Disposals during the period — 18
Amortization during the period – 114 – 143
Accumulated amortization December 31 – 701 – 588
Net book value January 1 166 319
Net book value December 31 50 165
5. TANGIBLE ASSETS
At the end of and the parent company had only
minor amounts of tangible assets. These assets were leased
from Nokia Asset Management Oy, a company wholly owned by
Nokia Corporation.


