Nokia 2013 Annual Report Download - page 139
Download and view the complete annual report
Please find page 139 of the 2013 Nokia annual report below. You can navigate through the pages in the report by either clicking on the pages listed below, or by using the keyword search tool below to find specific information within the annual report.-
 1
1 -
2
-
3
-
4
-
5
-
6
-
7
-
8
-
9
-
10
-
11
-
12
-
13
-
14
-
15
-
16
-
17
-
18
-
19
-
20
-
21
-
22
-
23
-
24
-
25
-
26
-
27
-
28
-
29
-
30
-
31
-
32
-
33
-
34
-
35
-
36
-
37
-
38
-
39
-
40
-
41
-
42
-
43
-
44
-
45
-
46
-
47
-
48
-
49
-
50
-
51
-
52
-
53
-
54
-
55
-
56
-
57
-
58
-
59
-
60
-
61
-
62
-
63
-
64
-
65
-
66
-
67
-
68
-
69
-
70
-
71
-
72
-
73
-
74
-
75
-
76
-
77
-
78
-
79
-
80
-
81
-
82
-
83
-
84
-
85
-
86
-
87
-
88
-
89
-
90
-
91
-
92
-
93
-
94
-
95
-
96
-
97
-
98
-
99
-
100
-
101
-
102
-
103
-
104
-
105
-
106
-
107
-
108
-
109
-
110
-
111
-
112
-
113
-
114
-
115
-
116
-
117
-
118
-
119
-
120
-
121
-
122
-
123
-
124
-
125
-
126
-
127
-
128
-
 129
129 -
 130
130 -
 131
131 -
 132
132 -
 133
133 -
 134
134 -
 135
135 -
 136
136 -
 137
137 -
 138
138 -
 139
139 -
 140
140 -
 141
141 -
 142
142 -
 143
143 -
 144
144 -
 145
145 -
 146
146
 |
 |

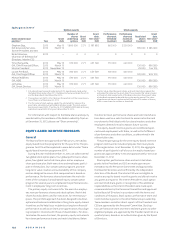
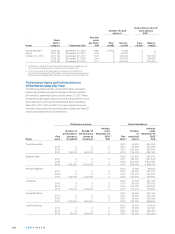
137
Performance shares Restricted shares
Intrinsic Intrinsic
Number of Number of value Number value
performance performance December31, of December31,
Plan shares at shares at 2013 4 Plan restricted 2013 6
Name name 1 threshold 2 maximum 3 EUR name 5 shares EUR
Henry Tirri 2010 30 000 174 600
2011 0 0 0 2011 35 000 203 700
2012 0 0 0 2012 75 000 436 500
2013 60 000 240 000 0 2013 70 000 407 400
Timo Toikkanen 2010 23 000 133 860
2011 0 0 0 2011 15 000 87 300
2012 0 0 0 2012 68 000 395 760
2013 100 000 400 000 0 2013 120 000 698 400
Chris Weber 2011 0 0 0 2011 90 000 523 800
2012 0 0 0 2012 68 000 395 760
2013 100 000 400 000 0 2013 120 000 698 400
Juha Äkräs 2010 55 000 320 100
2011 0 0 0 2011 35 000 203 700
2012 0 0 0 2012 75 000 436 500
2013 75 000 300 000 0 2013 90 000 523 800
Kai Öistämö 2010 55 000 320 100
2011 0 0 0 2011 35 000 203 700
2012 0 0 0 2012 60 000 349 200
2013 60 000 240 000 0 2013 70 000 407 400
Performance shares and
restricted shares held by the
Nokia Leadership Team, Total 7 1 462 500 5 850 000 0 4 264 000 24 816 480
All outstanding performance
shares and restricted shares
(global plans), Total 10 990 204 43 960 814 0 30 356 850 176 676 867
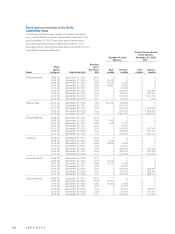
COMPENSATION OF THE BOARD OF DIRECTORS AND THE NOKIA GROUP LEADERSHIP TEAM
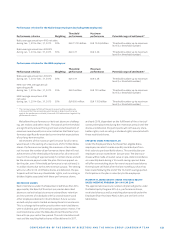
The performance period for the plan is – , for the plan
– (with a subsequent one-year restriction period) and for the
plan – (with a subsequent one-year restriction period),
respectively.
The threshold number will vest as Nokia shares, subject to the pre-
determined threshold performance levels being met with respect to the
applicable performance criteria. No Nokia shares were delivered under
the Nokia Performance Share Plan , which would have vested in ,
as Nokia’s performance did not reach the threshold level with respect to
the applicable performance criteria. Therefore, the shares deliverable at
threshold equaled zero for the Nokia Performance Share Plan . There
will also be no payout from the Nokia Performance Share Plan as
the requisite threshold level with respect to the applicable performance
criteria was not reached. Therefore, the shares deliverable at threshold
equals zero for the Nokia Performance Share Plan .
The maximum number will vest as Nokia shares, subject to the pre-
determined maximum performance levels being met with respect to the
applicable performance criteria. The maximum number of performance
shares equals four times the number at threshold. No Nokia shares
were delivered under the Nokia Performance Share Plan , as Nokia’s
performance did not reach the requisite threshold level with respect to
the applicable performance criteria. Therefore, the shares deliverable at
maximum equaled zero for the Nokia Performance Share Plan . There
will also be no payout from the Nokia Performance Share Plan as
the requisite threshold level with respect to the applicable performance
criteria was not reached. Therefore, the shares deliverable at maximum
equals zero for the Nokia Performance Share Plan .
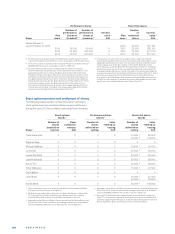
For Nokia Performance Share Plans and the value of perfor-
mance shares is presented on the basis of Nokia’s estimation of the
number of shares expected to vest. The intrinsic value for the Nokia
Performance Share Plan is based on the closing market price of a
Nokia share on NASDAQ OMX Helsinki as at December , of EUR
.. For the Nokia Performance Share Plan no Nokia shares were
delivered, as Nokia’s performance did not reach the threshold level of
either performance criteria. There will also be no payout from the Nokia
Performance Share Plan as the requisite threshold level with respect
to the applicable performance criteria was not reached. Therefore, the
shares deliverable at threshold equals zero for the Nokia Performance
Share Plan .
Under the Nokia Restricted Share Plans , , and , awards
have been granted quarterly. For the major part of the awards made
under these plans, the restriction period will end for the plan on
January , ; for the plan on January , ; for the plan on
July , ; and for the plan on July , .
The intrinsic value is based on the closing market price of a Nokia share on
NASDAQ OMX Helsinki as at December , of EUR ..
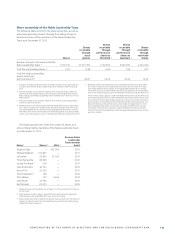
During , Marko Ahtisaari stepped down from the Nokia Leadership
Team. The information related to performance shares and restricted
shares held by Mr. Ahtisaari is as of the date of resignation from the Nokia
Leadership Team and is presented in the table below.