Nokia 2013 Annual Report Download - page 6
Download and view the complete annual report
Please find page 6 of the 2013 Nokia annual report below. You can navigate through the pages in the report by either clicking on the pages listed below, or by using the keyword search tool below to find specific information within the annual report.-
 1
1 -
 2
2 -
 3
3 -
 4
4 -
 5
5 -
 6
6 -
 7
7 -
 8
8 -
 9
9 -
 10
10 -
 11
11 -
 12
12 -
 13
13 -
 14
14 -
 15
15 -
 16
16 -
 17
17 -
18
-
19
-
20
-
21
-
22
-
23
-
24
-
25
-
26
-
27
-
28
-
29
-
30
-
31
-
32
-
33
-
34
-
35
-
36
-
37
-
38
-
39
-
40
-
41
-
42
-
43
-
44
-
45
-
46
-
47
-
48
-
49
-
50
-
51
-
52
-
53
-
54
-
55
-
56
-
57
-
58
-
59
-
60
-
61
-
62
-
63
-
64
-
65
-
66
-
67
-
68
-
69
-
70
-
71
-
72
-
73
-
74
-
75
-
76
-
77
-
78
-
79
-
80
-
81
-
82
-
83
-
84
-
85
-
86
-
87
-
88
-
89
-
90
-
91
-
92
-
93
-
94
-
95
-
96
-
97
-
98
-
99
-
100
-
101
-
102
-
103
-
104
-
105
-
106
-
107
-
108
-
109
-
110
-
111
-
112
-
113
-
114
-
115
-
116
-
117
-
118
-
119
-
120
-
121
-
122
-
123
-
124
-
125
-
126
-
127
-
128
-
129
-
130
-
131
-
132
-
133
-
134
-
135
-
136
-
137
-
138
-
139
-
140
-
141
-
142
-
143
-
144
-
145
-
146
 |
 |

NOKIA IN 2013
4
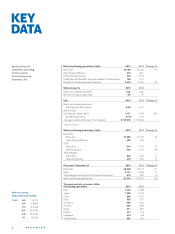
KEY
DATA
Based on fi nancial
statements according
to International
Financial Reporting
Standards, IFRS.
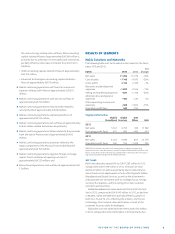
Nokia continuing operations, EURm 2013 2012 Change, %
Net sales 12709 15400 – 17
Operating profi t/loss 519 – 821
Profi t/loss before tax 243 – 1179
Profi t/loss attributable to equity holders’ of the parent 186 – 771
Research and development expenses 2619 3081 – 15
Nokia Group, % 2013 2012
Return on capital employed neg. neg.
Net debt to equity (gearing) – 35 – 47
EUR 2013 2012 Change, %
Nokia continuing operations
Earnings per share, basic 0.05 – 0.21
Nokia Group
Earnings per share, basic – 0.17 – 0. 84 – 80
Dividend per share 0.37 * 0.00
Average number of shares (1 000 shares) 3712079 3710845
* Board’s proposal
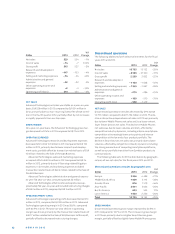
Nokia continuing businesses, EURm 2013 2012 Change, %
Networks
Net sales 11282 13779 -18
Operating profi t/loss 420 – 795
HERE
Net sales 914 1103 – 17
Operating loss – 154 – 301 – 49
Technologies
Net sales 529 534 – 1
Operating profi t 310 325 – 5
Personnel, December 31 2013 2012 Change, %
Networks 48628 58411 – 17
HERE 5741 6186 – 7
Technologies and Corporate Common Functions 875 950 – 8
Nokia continuing operations 55244 65547 – 16
10 major markets, net sales; EURm
Continuing operations 2013 2012
USA 1542 1498
Japan 1388 2176
China 896 1077
India 656 757
Germany 609 844
Finland 594 659
Brazil 511 805
Russia 421 476
Indonesia 410 418
Great Britain 392 540
Main currencies,
rates at the end of ƳƱƲƴ
1 EUR USD 1.3751
GBP 0.8444
CNY 8.3498
INR 85.1620
RUB 45.2264
JPY 141.80