Nokia 2013 Annual Report Download - page 70
Download and view the complete annual report
Please find page 70 of the 2013 Nokia annual report below. You can navigate through the pages in the report by either clicking on the pages listed below, or by using the keyword search tool below to find specific information within the annual report.-
 1
1 -
2
-
3
-
4
-
5
-
6
-
7
-
8
-
9
-
10
-
11
-
12
-
13
-
14
-
15
-
16
-
17
-
18
-
19
-
20
-
21
-
22
-
23
-
24
-
25
-
26
-
27
-
28
-
29
-
30
-
31
-
32
-
33
-
34
-
35
-
36
-
37
-
38
-
39
-
40
-
41
-
42
-
43
-
44
-
45
-
46
-
47
-
48
-
49
-
50
-
51
-
52
-
53
-
54
-
55
-
56
-
57
-
58
-
59
-
 60
60 -
 61
61 -
 62
62 -
 63
63 -
 64
64 -
 65
65 -
 66
66 -
 67
67 -
 68
68 -
 69
69 -
 70
70 -
 71
71 -
 72
72 -
 73
73 -
 74
74 -
 75
75 -
 76
76 -
 77
77 -
 78
78 -
 79
79 -
 80
80 -
81
-
82
-
83
-
84
-
85
-
86
-
87
-
88
-
89
-
90
-
91
-
92
-
93
-
94
-
95
-
96
-
97
-
98
-
99
-
100
-
101
-
102
-
103
-
104
-
105
-
106
-
107
-
108
-
109
-
110
-
111
-
112
-
113
-
114
-
115
-
116
-
117
-
118
-
119
-
120
-
121
-
122
-
123
-
124
-
125
-
126
-
127
-
128
-
129
-
130
-
131
-
132
-
133
-
134
-
135
-
136
-
137
-
138
-
139
-
140
-
141
-
142
-
143
-
144
-
145
-
146
 |
 |

NOKIA IN 2013
68
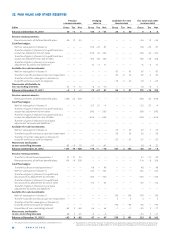
29. EARNINGS PER SHARE
2013 2012 2011
Numerator/EURm
Basic:
Profi t attributable to equity
holders of the parent
Continuing operations 186 – 771 – 1 272
Discontinued operations – 801 – 2 334 109
Total Group – 615 – 3 105 – 1 163
Diluted:
Elimination of interest expense,
net of tax, on convertible
bonds, where dilutive — — —
Profi t used to determine
diluted earnings per share
Continuing operations 186 – 771 – 1 272
Discontinued operations – 801 – 2 334 109
Total Group – 615 – 3 105 – 1 163
Denominator/1 000 shares
Basic:
Weighted average
number of shares
in issue 3 712 079 3 710 845 3 709 947
Eff ect of dilutive securities:
Stock options 1 978 — 473
Performance shares — — —
Restricted shares
and other 19 307 — 6 614
21 285 7 087
Assumed conversion
of convertible bonds — — —
—
Diluted:
Adjusted weighted average
number of shares and
assumed conversions
Continuing
operations 3 733 364 3 710 845 3 709 947
Discontinued
operations 3 712 079 3 710 845 3 717 034
Total Group 3712079 3710845 3709947
Basic earnings per share is calculated by dividing the profi t
attributable to equity holders of the parent by the weighted
average number of shares outstanding during the year exclud-
ing shares purchased by the Group and held as treasury shares.
Diluted earnings per share is calculated by adjusting the profi t
attributable to equity holders of the parent to eliminate
the interest expense of the dilutive convertible bond and by
adjusting the weighted average number of shares outstanding
with the dilutive eff ect of stock options, restricted shares and
performance shares outstanding during the period as well as
the assumed conversion of convertible bonds.
In , stock options equivalent to million shares (
million in and million in ) were excluded from the
calculation of diluted earnings per share because they were
determined to be anti-dilutive.
In addition, million of performance shares ( million in
and million in ) were excluded from the calculation of dilu-
tive shares because contingency conditions have not been met.
As at December , , there were million ( million in
and million in ) of restricted shares outstanding
that could potentially have a dilutive impact in the future but
were excluded from the calculation as they were determined
anti-dilutive.
Convertible bonds issued to Microsoft in September,
were excluded from the calculation of diluted shares in
because they were determined to be antidilutive. These
potential shares, if fully converted, would result in an issuance
of million shares. As a result of the closing of the sale of
Device & Services business the bonds have been redeemed.
The convertible bond includes a voluntary conver-
sion option. Based on the initial conversion price, voluntary
conversion of the entire bond would result in the issue of
million shares. These potential shares were excluded from the
calculation of diluted shares in and because they
were determined to be antidilutive at December , and
, respectively.
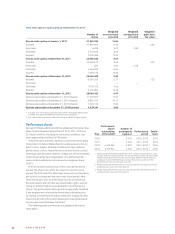
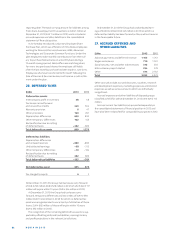
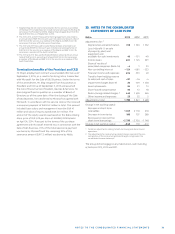
30. COMMITMENTS AND CONTINGENCIES
EURm 2013 1 2012 2
Collateral for own commitments
Assets pledged 38 38
Contingent liabilities on behalf
of Group companies
Other guarantees 778 937
Contingent liabilities on behalf
of associated companies
Financial guarantees on behalf
of associated companies 16 11
Contingent liabilities on behalf
of other companies
Financial guarantees on behalf
of third parties 3 12 12
Other guarantees 103 68
Financing commitments
Customer fi nance commitments 3 25 34
Venture fund commitments 215 282
Continuing operations
Nokia Group
See also Note Risk Management.
The amounts above represent the maximum principal amount
of commitments and contingencies.
Other guarantees on behalf of Group Companies include
commercial guarantees of EUR million in (EUR
million in ) provided to certain NSN customers in the form
of bank guarantees or corporate guarantees issued by NSN’s
Group entity. These instruments entitle the customer to claim
payment as compensation for non-performance by NSN of its
obligations under network infrastructure supply agreements.
Depending on the nature of the guarantee, compensation is
payable on demand or subject to verifi cation of non-perfor-