Nokia 2013 Annual Report Download - page 27
Download and view the complete annual report
Please find page 27 of the 2013 Nokia annual report below. You can navigate through the pages in the report by either clicking on the pages listed below, or by using the keyword search tool below to find specific information within the annual report.-
 1
1 -
2
-
3
-
4
-
5
-
6
-
7
-
8
-
9
-
10
-
11
-
12
-
13
-
14
-
15
-
16
-
 17
17 -
 18
18 -
 19
19 -
 20
20 -
 21
21 -
 22
22 -
 23
23 -
 24
24 -
 25
25 -
 26
26 -
 27
27 -
 28
28 -
 29
29 -
 30
30 -
 31
31 -
 32
32 -
 33
33 -
 34
34 -
 35
35 -
 36
36 -
 37
37 -
38
-
39
-
40
-
41
-
42
-
43
-
44
-
45
-
46
-
47
-
48
-
49
-
50
-
51
-
52
-
53
-
54
-
55
-
56
-
57
-
58
-
59
-
60
-
61
-
62
-
63
-
64
-
65
-
66
-
67
-
68
-
69
-
70
-
71
-
72
-
73
-
74
-
75
-
76
-
77
-
78
-
79
-
80
-
81
-
82
-
83
-
84
-
85
-
86
-
87
-
88
-
89
-
90
-
91
-
92
-
93
-
94
-
95
-
96
-
97
-
98
-
99
-
100
-
101
-
102
-
103
-
104
-
105
-
106
-
107
-
108
-
109
-
110
-
111
-
112
-
113
-
114
-
115
-
116
-
117
-
118
-
119
-
120
-
121
-
122
-
123
-
124
-
125
-
126
-
127
-
128
-
129
-
130
-
131
-
132
-
133
-
134
-
135
-
136
-
137
-
138
-
139
-
140
-
141
-
142
-
143
-
144
-
145
-
146
 |
 |

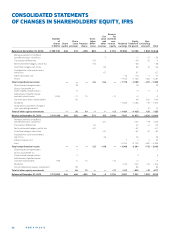
25
NOKIA CORPORATION AND SUBSIDIARIES
CONSOLIDATED STATEMENTS
OF CASH FLOWS, IFRS
2012 * 2011 *
2013
FinancialyearendedDecember31 Notes EURm EURm EURm
Cash fl ow from operating activities
Loss attributable to equity holders of the parent – 615 – 3105 – 1163
Adjustments, total 33 1789 3841 3488
Change in net working capital 33 – 945 119 – 641
Cash generated from operations 229 855 1684
Interest received 92 130 190
Interest paid – 208 – 277 – 283
Other fi nancial income and expenses, net 345 – 584 264
Income taxes paid, net – 386 – 478 – 718
Net cash from/used in operating activities 72 – 354 1137
Cash fl ow from investing activities
Acquisition of businesses, net of acquired cash — 13 – 817
Purchase of current available-for-sale investments, liquid assets – 1021 – 1668 – 3676
Purchase of investments at fair value through profi t and loss, liquid assets — – 40 – 607
Purchase of non-current available-for-sale investments – 53 – 55 – 111
Purchase of shares in associated companies – 8 – 1 – 2
Payment of other long-term receivables – 1 — – 14
Proceeds from (+)/payment of (–) short-term loans receivable 4 24 – 31
Capital expenditures – 407 – 461 – 597
Proceeds from disposal of businesses, net of disposed cash – 63 – 15 – 2
Proceeds from disposal of shares in associated companies — 5 4
Proceeds from maturities and sale of current available-for-sale investments,
liquid assets 586 2355 6090
Proceeds from maturities and sale of investments at fair value
through profi t and loss, liquid assets — 86 1156
Proceeds from sale of non-current available-for-sale investments 129 37 57
Proceeds from sale of fi xed assets 138 279 48
Dividends received 5 3 1
Net cash used in/from investing activities – 691 562 1499
Cash fl ow from fi nancing activities
Other contributions from shareholders — — 546
Purchase of a subsidiary’s equity instruments – 1707 — —
Proceeds from long-term borrowings 2291 752 1
Repayment of long-term borrowings – 862 – 266 – 51
Repayment of short-term borrowings – 128 – 196 – 59
Dividends paid – 71 – 755 – 1536
Net cash used in fi nancing activities – 477 – 465 – 1099
Foreign exchange adjustment – 223 – 27 107
Net decrease (–)/increase (+) in cash and cash equivalents – 1319 – 284 1644
Cash and cash equivalents at beginning of period 8 952 9236 7592
Cash and cash equivalents at end of period 7633 8952 9236
Cash and cash equivalents comprise of:
Bank and cash 3676 3504 1957
Current available-for-sale investments, cash equivalents 17,35 3 957 5 448 7 279
7 633 8 952 9 236
The figures in the consolidated statement of cash flows combine cash flows relating to both continuing and discontinued operations.
Note includes information about discontinued operations cash flows.
The figures in the consolidated statement cash flows cannot be directly traced from the balance sheet without additional information as a result
of acquisitions and disposals of subsidiaries and net foreign exchange differences arising on consolidation.
* Full years and reflect the retrospective application of Revised IAS , Employee Benefits.
See Notes to Consolidated Financial Statements.