Nokia 2013 Annual Report Download - page 29
Download and view the complete annual report
Please find page 29 of the 2013 Nokia annual report below. You can navigate through the pages in the report by either clicking on the pages listed below, or by using the keyword search tool below to find specific information within the annual report.-
 1
1 -
2
-
3
-
4
-
5
-
6
-
7
-
8
-
9
-
10
-
11
-
12
-
13
-
14
-
15
-
16
-
17
-
18
-
 19
19 -
 20
20 -
 21
21 -
 22
22 -
 23
23 -
 24
24 -
 25
25 -
 26
26 -
 27
27 -
 28
28 -
 29
29 -
 30
30 -
 31
31 -
 32
32 -
 33
33 -
 34
34 -
 35
35 -
 36
36 -
 37
37 -
 38
38 -
 39
39 -
40
-
41
-
42
-
43
-
44
-
45
-
46
-
47
-
48
-
49
-
50
-
51
-
52
-
53
-
54
-
55
-
56
-
57
-
58
-
59
-
60
-
61
-
62
-
63
-
64
-
65
-
66
-
67
-
68
-
69
-
70
-
71
-
72
-
73
-
74
-
75
-
76
-
77
-
78
-
79
-
80
-
81
-
82
-
83
-
84
-
85
-
86
-
87
-
88
-
89
-
90
-
91
-
92
-
93
-
94
-
95
-
96
-
97
-
98
-
99
-
100
-
101
-
102
-
103
-
104
-
105
-
106
-
107
-
108
-
109
-
110
-
111
-
112
-
113
-
114
-
115
-
116
-
117
-
118
-
119
-
120
-
121
-
122
-
123
-
124
-
125
-
126
-
127
-
128
-
129
-
130
-
131
-
132
-
133
-
134
-
135
-
136
-
137
-
138
-
139
-
140
-
141
-
142
-
143
-
144
-
145
-
146
 |
 |

27
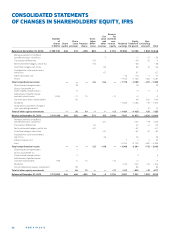
NOKIA CORPORATION AND SUBSIDIARIES
CONSOLIDATED STATEMENTS
OF CHANGES IN SHAREHOLDERS’ EQUITY, IFRS (continued)
Reserve
Fair for
Number Trans- value invested
of Share lation and non- Equity Non-
shares Share issue Treasury diff er- other restrict. Retained holders of controlling
(1 000’s) capital premium shares ences reserves equity earnings the parent interests Total
Balance at December31, 2012 3710985 246 446 – 629 746 – 5 3136 3997 7937 1302 9239
Remeasurement on defi ned
benefi t pensions, net of tax 55 55 25 80
Translation diff erences – 468 – 468 – 28 – 496
Net investment hedges, net of tax 114 114 114
Cash fl ow hedges, net of tax – 3 – 3 7 4
Available-for-sale investments,
net of tax 49 49 — 49
Other increase, net 5 5 — 5
Loss – 615 – 615 – 124 – 739
Total comprehensive income — — — – 354 101 — – 610 – 863 – 120 – 983
Share-based compensation 25 25 25
Settlement of performance
and restricted shares 1 404 – 7 26 – 21 – 2 – 2
Dividend — — – 37 – 37
Acquisition of non-controlling
interest – 3 42 – 16 – 806 – 783 – 924 – 1707
Other change in non-controlling
interest — – 29 – 29
Convertible bond – equity
component 154 154 154
Convertible bond – conversion
to equity 38 — — —
Total of other equity movements — 169 26 42 – 16 – 21 – 806 – 606 – 990 – 1596
Balance at December31, 2013 3712427 246 615 – 603 434 80 3115 2581 6468 192 6660
Dividends declared per share were EUR . for (EUR . for and EUR . for ), subject to shareholders’ approval.
See Notes to Consolidated Financial Statements.