Nokia 2013 Annual Report Download - page 60
Download and view the complete annual report
Please find page 60 of the 2013 Nokia annual report below. You can navigate through the pages in the report by either clicking on the pages listed below, or by using the keyword search tool below to find specific information within the annual report.-
 1
1 -
2
-
3
-
4
-
5
-
6
-
7
-
8
-
9
-
10
-
11
-
12
-
13
-
14
-
15
-
16
-
17
-
18
-
19
-
20
-
21
-
22
-
23
-
24
-
25
-
26
-
27
-
28
-
29
-
30
-
31
-
32
-
33
-
34
-
35
-
36
-
37
-
38
-
39
-
40
-
41
-
42
-
43
-
44
-
45
-
46
-
47
-
48
-
49
-
 50
50 -
 51
51 -
 52
52 -
 53
53 -
 54
54 -
 55
55 -
 56
56 -
 57
57 -
 58
58 -
 59
59 -
 60
60 -
 61
61 -
 62
62 -
 63
63 -
 64
64 -
 65
65 -
 66
66 -
 67
67 -
 68
68 -
 69
69 -
 70
70 -
71
-
72
-
73
-
74
-
75
-
76
-
77
-
78
-
79
-
80
-
81
-
82
-
83
-
84
-
85
-
86
-
87
-
88
-
89
-
90
-
91
-
92
-
93
-
94
-
95
-
96
-
97
-
98
-
99
-
100
-
101
-
102
-
103
-
104
-
105
-
106
-
107
-
108
-
109
-
110
-
111
-
112
-
113
-
114
-
115
-
116
-
117
-
118
-
119
-
120
-
121
-
122
-
123
-
124
-
125
-
126
-
127
-
128
-
129
-
130
-
131
-
132
-
133
-
134
-
135
-
136
-
137
-
138
-
139
-
140
-
141
-
142
-
143
-
144
-
145
-
146
 |
 |

NOKIA IN 2013
58
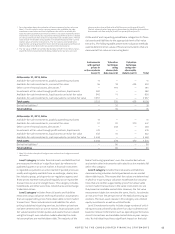
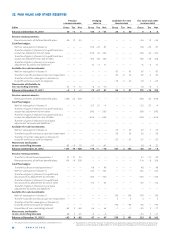
22. FAIR VALUE AND OTHER RESERVES
Pension Hedging Available-for-sale Fairvalueandother
remeasurements reserve investments reservestotal
EURm Gross Tax Net Gross Tax Net Gross Tax Net Gross Tax Net
Balance at December31, 2010 10 – 4 6 – 30 3 – 27 26 4 30 6 3 9
Pension remeasurements:
Remeasurements of defi ned benefi t plans – 36 12 – 24 — — — — — — – 36 12 – 24
Cash fl ow hedges:
Net fair value gains (+)/losses (–) — — — 106 – 25 81 — — — 106 – 25 81
Transfer of gains (–)/losses (+) to profi t and loss
account as adjustment to net sales — — — – 166 42 – 124 — — — – 166 42 – 124
Transfer of gains (–)/losses (+) to profi t and loss
account as adjustment to cost of sales — — — 162 – 36 126 — — — 162 – 36 126
Transfer of gains (–)/losses (+) as a basis
adjustment to assets and liabilities 1 — — — 14 – 3 11 — — — 14 – 3 11
Available-for-sale investments:
Net fair value gains (+)/losses (–) — — — — — — 67 — 67 67 — 67
Transfer to profi t and loss account on impairment — — — — — — 22 – 2 20 22 – 2 20
Transfer of net fair value gains (–)/losses (+)
to profi t and loss account on disposal — — — — — — – 19 – 1 – 20 – 19 – 1 – 20
Movements attributable to
non-controlling interests 24 – 7 17 – 8 – 2 – 10 — — — 16 – 9 7
Balance at December31, 2011 – 2 1 – 1 78 – 21 57 96 1 97 172 – 19 153
Pension remeasurements:
Remeasurements of defi ned benefi t plans – 228 22 – 206 — — — — — — – 228 22 – 206
Cash fl ow hedges:
Net fair value gains (+)/losses (–) — — — – 25 21 – 4 — — — – 25 21 – 4
Transfer of gains (–)/losses (+) to profi t and loss
account as adjustment to net sales — — — 390 — 390 — — — 390 — 390
Transfer of gains (–)/losses (+) to profi t and loss
account as adjustment to cost of sales — — — – 406 — – 406 — — — – 406 — – 406
Transfer of gains (–)/losses (+) as a basis
adjustment to assets and liabilities 1 — — — — — — — — — — — —
Available-for-sale investments:
Net fair value gains (+)/losses (–) — — — — — — 32 1 33 32 1 33
Transfer to profi t and loss account on impairment — — — — — — 24 — 24 24 — 24
Transfer of net fair value gains (–)/losses (+)
to profi t and loss account on disposal — — — — — — – 21 — – 21 – 21 — – 21
Movements attributable
to non-controlling interests 83 – 4 79 – 47 — – 47 — — — 36 – 4 32
Balance at December31, 2012 – 147 19 – 128 – 10 — – 10 131 2 133 – 26 21 – 5
Pension remeasurements:
Transfer to discontinued operations 2 31 – 11 20 — — — — — — 31 – 11 20
Remeasurements of defi ned benefi t plans 114 – 6 108 — — — — — — 114 – 6 108
Cash fl ow hedges:
Transfer to discontinued operations 2 — — — 48 — 48 — — — 48 — 48
Net fair value gains (+)/losses (–) — — — 124 — 124 — — — 124 — 124
Transfer of gains (–)/losses (+) to profi t and
loss account as adjustment to net sales — — — – 130 — – 130 — — — – 130 — – 130
Transfer of gains (–)/losses (+) to profi t and
loss account as adjustment to cost of sales — — — – 23 — – 23 — — — – 23 — – 23
Transfer of gains (–)/losses (+) as a basis
adjustment to assets and liabilities 1 — — — — — — — — — — — —
Available-for-sale investments:
Net fair value gains (+)/losses (–) — — — — — — 139 — 139 139 — 139
Transfer to profi t and loss account on impairment — — — — — — 5 — 5 5 — 5
Transfer of net fair value gains (–)/losses (+)
to profi t and loss account on disposal — — — — — — – 95 — – 95 – 95 — – 95
Acquisition of non-controlling interest – 63 3 – 60 44 — 44 – 1 — – 1 – 20 3 – 17
Movements attributable
to non-controlling interests – 28 3 – 25 – 6 — – 6 — — — – 34 3 – 31
Balance at December31, 2013 2 – 93 8 – 85 47 — 47 179 2 181 133 10 143
The adjustments relate to acquisitions completed in . Movements in after transfer to discontinued operations represents movements of continuing
operations and the balance at December , represents the balance of continuing operations.