Nokia 2013 Annual Report Download - page 53
Download and view the complete annual report
Please find page 53 of the 2013 Nokia annual report below. You can navigate through the pages in the report by either clicking on the pages listed below, or by using the keyword search tool below to find specific information within the annual report.-
 1
1 -
2
-
3
-
4
-
5
-
6
-
7
-
8
-
9
-
10
-
11
-
12
-
13
-
14
-
15
-
16
-
17
-
18
-
19
-
20
-
21
-
22
-
23
-
24
-
25
-
26
-
27
-
28
-
29
-
30
-
31
-
32
-
33
-
34
-
35
-
36
-
37
-
38
-
39
-
40
-
41
-
42
-
 43
43 -
 44
44 -
 45
45 -
 46
46 -
 47
47 -
 48
48 -
 49
49 -
 50
50 -
 51
51 -
 52
52 -
 53
53 -
 54
54 -
 55
55 -
 56
56 -
 57
57 -
 58
58 -
 59
59 -
 60
60 -
 61
61 -
 62
62 -
 63
63 -
64
-
65
-
66
-
67
-
68
-
69
-
70
-
71
-
72
-
73
-
74
-
75
-
76
-
77
-
78
-
79
-
80
-
81
-
82
-
83
-
84
-
85
-
86
-
87
-
88
-
89
-
90
-
91
-
92
-
93
-
94
-
95
-
96
-
97
-
98
-
99
-
100
-
101
-
102
-
103
-
104
-
105
-
106
-
107
-
108
-
109
-
110
-
111
-
112
-
113
-
114
-
115
-
116
-
117
-
118
-
119
-
120
-
121
-
122
-
123
-
124
-
125
-
126
-
127
-
128
-
129
-
130
-
131
-
132
-
133
-
134
-
135
-
136
-
137
-
138
-
139
-
140
-
141
-
142
-
143
-
144
-
145
-
146
 |
 |

51
NOTES TO THE CONSOLIDATED FINANCIAL STATEMENTS
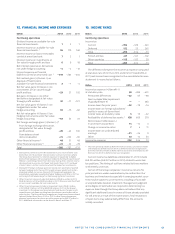
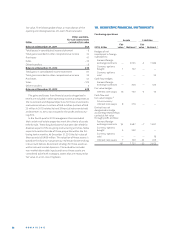
12. FINANCIAL INCOME AND EXPENSES
EURm 2013 2012 2011
Continuing operations
Dividend income on available-for-sale
fi nancial investments 1 3 1
Interest income on available-for-sale
fi nancial investments 1 95 119 169
Interest income on loans receivables
carried at amortized cost 7 3 1
Interest income on investments at
fair value through profi t and loss 6 8 18
Net interest expense on derivatives
not under hedge accounting – 4 – 4 – 12
Interest expense on fi nancial
liabilities carried at amortized cost 1 – 319 – 263 – 255
Net realised gains (+)/losses (–) on
disposal of fi xed income
available-for-sale fi nancial investments 2 – 1 – 4
Net fair value gains (+)/losses (–) on
investments at fair value through
profi t and loss – 29 27 102
Net gains (+)/losses (–) on other
derivatives designated at fair value
through profi t and loss 32 – 11 – 121
Net fair value gains (+)/losses (–) on
hedged items under fair value
hedge accounting 69 – 15 – 82
Net fair value gains (+)/losses (–) on
hedging instruments under fair value
hedge accounting – 63 23 72
Net foreign exchange gains (+)/losses (–) 2
From foreign exchange derivatives
designated at fair value through
profi t and loss – 28 – 42 100
From balance sheet
items revaluation – 74 – 223 – 90
Other fi nancial income 3 48 51 48
Other fi nancial expenses 4 – 23 – 32 – 78
Total – 280 – 357 – 131
During , interest income decreased mainly as a result of lower cash
levels than in and lower interest rates in certain currencies where
the Group has investments. Interest expense increased due to higher
levels of borrowing as well as expenses related to funding the purchase of
NSN non-controlling interest from Siemens. During , interest income
decreased mainly as a result of lower cash levels than in and lower
interest rates in certain currencies where the Group has investments.
During foreign exchange gains (or losses) were positively impacted
by lower hedging costs than in as well as lower volatility of certain
emerging market currencies. During foreign exchange gains (or
losses) were negatively impacted by higher hedging costs than in as
well as significant weakening of certain emerging market currencies.
Other financial income includes distributions of EUR million in
(EUR million in and EUR million in ) from a private fund held
as non-current available-for-sale investments.
Other financial expenses include an impairment loss of EUR million
in (EUR million in and EUR million in ) in the Group’s
investment in the above mentioned private fund due to changes in esti-
mated future cash flows resulting from distributions received as well as
other factors. The Group did not recognize any impairment losses related
to Asset Backed Securities in or in other financial expenses,
whereas impairments for these securities amounted to EUR million in
. Additional information can be found in Note and Note .
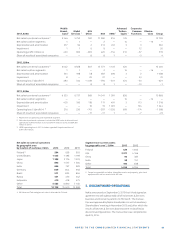
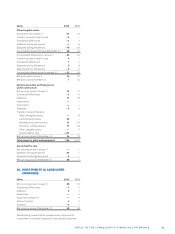
13. INCOME TAXES
EURm 2013 2012 2011
Continuing operations
Income tax
Current – 354 – 329 – 340
Deferred 152 25 267
Total – 202 – 304 – 73
Finnish entities – 87 – 147 – 102
Other countries – 115 – 157 29
Total – 202 – 304 – 73
The diff erences between the income tax expense computed
at statutory rate of .% in and in Finland (% in
) and income taxes recognized in the consolidated income
statement is reconciled as follows:
EURm 2013 2012 2011
Income tax expense (+)/benefi t (–)
at statutory rate 60 – 289 – 401
Permanent diff erences – 22 67 – 98
Non tax deductible impairment
of goodwill (Note9) — — 283
Income taxes for prior years – 22 – 78 – 16
Income taxes on foreign subsidiaries’
profi ts in excess of (lower than)
income taxes at statutory rates 5 15 – 22
Realizability of deferred tax assets 1 138 609 279
Net increase (+)/decrease (–)
in uncertain tax positions 14 – 14 3
Change in income tax rates 7 4 11
Income taxes on undistributed
earnings – 21 – 24 9
Other 43 14 25
Income tax expense 202 304 73
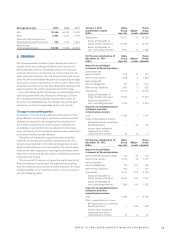
This item primarily relates to NSN’s Finnish tax losses, unused tax credits
and temporary differences for which no deferred tax was recognized. In
this item also relates to NSN’s German tax losses and temporary dif-
ferences for which no deferred tax was recognized.
Current income tax liabilities at December , include
EUR million (EUR million in ) related to uncertain
tax positions. The timing of outfl ows related to these matters
is inherently uncertain.
Certain of the Group companies’ income tax returns for
prior periods are under examination by tax authorities. Our
business and investments especially in emerging market coun-
tries may be subject to uncertainties, including unfavorable
or unpredictable taxation treatment. Management judgment
and a degree of estimation are required in determining tax
expense. Even though the Group does not believe that any
signifi cant additional taxes in excess of those already provided
for will arise as a result of the examinations, fi nal resolutions
of open items may substantially diff er from the amounts
initially recorded.