Nokia 2013 Annual Report Download - page 24
Download and view the complete annual report
Please find page 24 of the 2013 Nokia annual report below. You can navigate through the pages in the report by either clicking on the pages listed below, or by using the keyword search tool below to find specific information within the annual report.-
 1
1 -
2
-
3
-
4
-
5
-
6
-
7
-
8
-
9
-
10
-
11
-
12
-
13
-
 14
14 -
 15
15 -
 16
16 -
 17
17 -
 18
18 -
 19
19 -
 20
20 -
 21
21 -
 22
22 -
 23
23 -
 24
24 -
 25
25 -
 26
26 -
 27
27 -
 28
28 -
 29
29 -
 30
30 -
 31
31 -
 32
32 -
 33
33 -
 34
34 -
35
-
36
-
37
-
38
-
39
-
40
-
41
-
42
-
43
-
44
-
45
-
46
-
47
-
48
-
49
-
50
-
51
-
52
-
53
-
54
-
55
-
56
-
57
-
58
-
59
-
60
-
61
-
62
-
63
-
64
-
65
-
66
-
67
-
68
-
69
-
70
-
71
-
72
-
73
-
74
-
75
-
76
-
77
-
78
-
79
-
80
-
81
-
82
-
83
-
84
-
85
-
86
-
87
-
88
-
89
-
90
-
91
-
92
-
93
-
94
-
95
-
96
-
97
-
98
-
99
-
100
-
101
-
102
-
103
-
104
-
105
-
106
-
107
-
108
-
109
-
110
-
111
-
112
-
113
-
114
-
115
-
116
-
117
-
118
-
119
-
120
-
121
-
122
-
123
-
124
-
125
-
126
-
127
-
128
-
129
-
130
-
131
-
132
-
133
-
134
-
135
-
136
-
137
-
138
-
139
-
140
-
141
-
142
-
143
-
144
-
145
-
146
 |
 |

NOKIA IN 2013
22
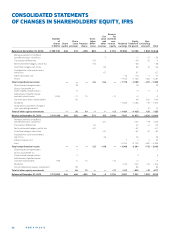
CONSOLIDATED INCOME STATEMENTS, IFRS
2013
FinancialyearendedDecember31 Notes EURm EURm EURm
Continuing operations
Net sales 12 709 15 400 15 968
Cost of sales – 7 364 – 9 841 – 10 408
Gross profi t 5 345 5 559 5 560
Research and development expenses – 2 619 – 3 081 – 3 334
Selling and marketing expenses – 974 – 1 372 – 1 608
Administrative and general expenses – 697 – 690 – 735
Impairment of goodwill 9 — — – 1 090
Other income 8 272 276 151
Other expenses 8,9 – 808 – 1 513 – 332
Operating profi t (+)/loss (–) 2 – 11,25 519 – 821 – 1 388
Share of results of associated companies 16,32 4 – 1 – 23
Financial income and expenses 9,12 – 280 – 357 – 131
Profi t (+)/loss (–) before tax 243 – 1 179 – 1 542
Income tax 13 – 202 – 304 – 73
Profi t (+)/loss (–) from continuing operations 41 – 1 483 – 1 615
Profi t (+)/loss (–) from continuing operations
attributable to equity holders of the parent 186 – 771 – 1 272
Loss from continuing operations attributable to non-controlling interests – 145 – 712 – 343
41 – 1 483 – 1 615
Loss (–)/profi t (+) from discontinued operations 3 – 780 – 2 303 128
Loss (–)/profi t (+) from discontinued operations
attributable to equity holders of the parent – 801 – 2 334 109
Profi t from discontinued operations attributable to non-controlling interests 21 31 19
– 780 – 2 303 128
Loss for the year – 739 – 3 786 – 1 487
Loss attributable to equity holders of the parent – 615 – 3 105 – 1 163
Loss attributable to non-controlling interests – 124 – 681 – 324
– 739 – 3 786 – 1 487
Earnings per share from continuing and discontinued operations 2013 2012 2011
(for profi t (+)/loss (–) attributable to the equity holders of the parent) 29 EUR EUR EUR
Basic earnings per share
From continuing operations 0.05 – 0.21 – 0.34
From discontinued operations – 0.22 – 0.63 0.03
From the profi t of the year – 0.17 – 0.84 – 0.31
Diluted earnings per share
From continuing operations 0.05 – 0.21 – 0.34
From discontinued operations – 0.22 – 0.63 0.03
From the profi t of the year – 0.17 – 0.84 – 0.31
Average number of shares (000’s shares) 29
Basic
From continuing operations 3 712 079 3 710 845 3 709 947
From discontinued operations 3 712 079 3 710 845 3709947
From the profi t of the year 3 712 079 3 710 845 3 709 947
Diluted
From continuing operations 3 733 364 3 710 845 3 709 947
From discontinued operations 3 712 079 3710845 3 717 034
From the profi t of the year 3712079 3 710 845 3 709 947
* Full years and reflect the retrospective application of Revised IAS , Employee Benefits.
See Notes to Consolidated Financial Statements.
2012 * 2011 *