Nokia 2013 Annual Report Download - page 13
Download and view the complete annual report
Please find page 13 of the 2013 Nokia annual report below. You can navigate through the pages in the report by either clicking on the pages listed below, or by using the keyword search tool below to find specific information within the annual report.-
 1
1 -
2
-
 3
3 -
 4
4 -
 5
5 -
 6
6 -
 7
7 -
 8
8 -
 9
9 -
 10
10 -
 11
11 -
 12
12 -
 13
13 -
 14
14 -
 15
15 -
 16
16 -
 17
17 -
 18
18 -
 19
19 -
 20
20 -
 21
21 -
 22
22 -
 23
23 -
24
-
25
-
26
-
27
-
28
-
29
-
30
-
31
-
32
-
33
-
34
-
35
-
36
-
37
-
38
-
39
-
40
-
41
-
42
-
43
-
44
-
45
-
46
-
47
-
48
-
49
-
50
-
51
-
52
-
53
-
54
-
55
-
56
-
57
-
58
-
59
-
60
-
61
-
62
-
63
-
64
-
65
-
66
-
67
-
68
-
69
-
70
-
71
-
72
-
73
-
74
-
75
-
76
-
77
-
78
-
79
-
80
-
81
-
82
-
83
-
84
-
85
-
86
-
87
-
88
-
89
-
90
-
91
-
92
-
93
-
94
-
95
-
96
-
97
-
98
-
99
-
100
-
101
-
102
-
103
-
104
-
105
-
106
-
107
-
108
-
109
-
110
-
111
-
112
-
113
-
114
-
115
-
116
-
117
-
118
-
119
-
120
-
121
-
122
-
123
-
124
-
125
-
126
-
127
-
128
-
129
-
130
-
131
-
132
-
133
-
134
-
135
-
136
-
137
-
138
-
139
-
140
-
141
-
142
-
143
-
144
-
145
-
146
 |
 |

REVIEW BY THE BOARD OF DIRECTORS 11
price accounting items, by more than EUR . billion by the end
of , compared to the end of .
During , NSN recognized restructuring charges and
other associated items of EUR million related to this
restructuring program, resulting in cumulative charges of
approximately EUR million. By the end of , NSN had
cumulative restructuring related cash outfl ows of approxi-
mately EUR million relating to this restructuring program.
NSN expects restructuring related cash outfl ows to be ap-
proximately EUR million for the full year relating to
this restructuring program.
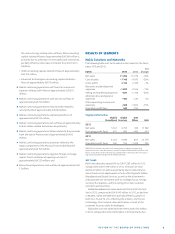
HERE
The following table sets forth selective line items for the fi scal
years and .
YoY
EURm 2013 2012 Change
Net sales 914 1 103 – 17%
Cost of sales – 208 – 228 – 9%
Gross profi t 706 875 – 19%
Research and development
expenses – 648 – 883 – 27%
Selling and marketing expenses – 119 – 186 – 36%
Administrative and general
expenses – 69 – 77 – 10%
Other operating income and
expenses – 24 – 30 – 20%
Operating profi t (loss) – 154 – 301
NET SALES
HERE net sales decreased % to EUR million in ,
compared to EUR million in . HERE internal net sales
decreased % to EUR million in , compared to EUR
million in . HERE external net sales increased % to EUR
million in , compared to EUR million in . The
year-on-year decline in HERE internal net sales was due to low-
er recognition of deferred revenue related to our smartphone
sales. The year-on-year increase in HERE external net sales in
was primarily due to higher sales to vehicle customers,
partially off set by lower sales to personal navigation devices
customers. Additionally, HERE net sales were negatively af-
fected by foreign currency fl uctuations.
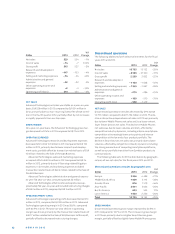
The following table sets forth the distribution by geographi-
cal area of our net sales for the fi scal years and .
HERE net sales by geographic area
YoY
EURm 2013 2012 Change
Europe 384 477 – 19%
Middle East & Africa 57 74 – 23%
Greater China 17 63 – 73%
Asia-Pacifi c 75 82 – 9%
North America 322 335 – 4%
Latin America 59 72 – 18%
Total 914 1 103 – 17%
GROSS MARGIN
On a year-on-year basis, the decrease in HERE gross margin,
.% in compared to .% in , was primarily due to
proportionally higher sales of update units to vehicle custom-
ers which generally carry a lower gross margin, partially off set
by lower costs related to service delivery.
OPERATING EXPENSES
HERE research and development expenses decreased % to
EUR million in compared to EUR million in ,
primarily due to a decrease in purchase price accounting
related items, EUR million in compared to EUR mil-
lion in , and cost reduction actions.
HERE sales and marketing expenses decreased % to EUR
million in compared to EUR million in , primar-
ily driven by a decrease in purchase price accounting items,
EUR million in compared to EUR million in , cost
reduction actions and lower marketing spending.
HERE administrative and general expenses decreased %
to EUR million in compared to EUR million in ,
primarily due cost reduction actions.
In , HERE other income and expense had a slightly
positive year-on-year impact on profi tability, decreasing from
EUR million in to EUR million in . In , we
recognized restructuring charges of EUR million in HERE,
compared to EUR million in .
OPERATING PROFIT (LOSS)
HERE operating loss decreased to EUR million in ,
compared with a loss of EUR million in . HERE operating
margin in was negative .%, compared with negative
.% in . The year-on-year improvement in operating
margin in was driven primarily by the absence of signifi -
cant purchase price accounting related items arising from the
purchase of NAVTEQ, the vast majority of which had been fully
amortized as of the end of the second quarter of .
Advanced Technologies
The following table sets forth selective line items for the fi scal
years and .