Nokia 2013 Annual Report Download - page 98
Download and view the complete annual report
Please find page 98 of the 2013 Nokia annual report below. You can navigate through the pages in the report by either clicking on the pages listed below, or by using the keyword search tool below to find specific information within the annual report.-
 1
1 -
2
-
3
-
4
-
5
-
6
-
7
-
8
-
9
-
10
-
11
-
12
-
13
-
14
-
15
-
16
-
17
-
18
-
19
-
20
-
21
-
22
-
23
-
24
-
25
-
26
-
27
-
28
-
29
-
30
-
31
-
32
-
33
-
34
-
35
-
36
-
37
-
38
-
39
-
40
-
41
-
42
-
43
-
44
-
45
-
46
-
47
-
48
-
49
-
50
-
51
-
52
-
53
-
54
-
55
-
56
-
57
-
58
-
59
-
60
-
61
-
62
-
63
-
64
-
65
-
66
-
67
-
68
-
69
-
70
-
71
-
72
-
73
-
74
-
75
-
76
-
77
-
78
-
79
-
80
-
81
-
82
-
83
-
84
-
85
-
86
-
87
-
 88
88 -
 89
89 -
 90
90 -
 91
91 -
 92
92 -
 93
93 -
 94
94 -
 95
95 -
 96
96 -
 97
97 -
 98
98 -
 99
99 -
 100
100 -
 101
101 -
 102
102 -
 103
103 -
 104
104 -
 105
105 -
 106
106 -
 107
107 -
 108
108 -
109
-
110
-
111
-
112
-
113
-
114
-
115
-
116
-
117
-
118
-
119
-
120
-
121
-
122
-
123
-
124
-
125
-
126
-
127
-
128
-
129
-
130
-
131
-
132
-
133
-
134
-
135
-
136
-
137
-
138
-
139
-
140
-
141
-
142
-
143
-
144
-
145
-
146
 |
 |

NOKIA IN 2013
96
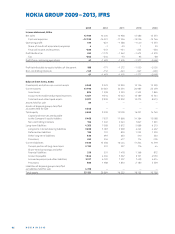
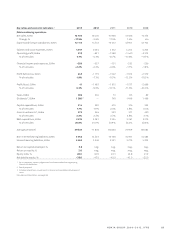
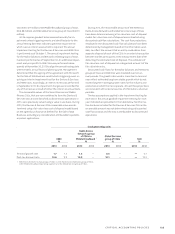
NOKIA GROUP 2009 – 2013, IFRS
2013 2012 2011 2010 2009
Income statement, EURm
Net sales 12709 15400 15968 13586 13373
Cost and expenses – 12190 – 16221 – 17356 – 15026 – 15746
Operating profi t 519 – 821 – 1388 – 1440 – 2373
Share of results of associated companies 4 – 1 – 23 1 30
Financial income and expenses – 2 80 – 357 – 131 – 233 – 236
Profi t before tax 243 – 1179 – 1542 – 1672 – 2579
Tax – 2 02 – 30 4 – 73 95 – 89
Profi t from continuing operations 41 – 1483 – 1615 – 1577 – 2668
Profi t attributable to equity holders of the parent 186 – 771 – 1272 – 1030 – 2 005
Non-controlling interests – 145 – 712 – 343 – 547 – 663
41 – 1483 – 1615 – 1577 – 2668
Balance sheet items, EURm
Fixed assets and other non-current assets 6048 9323 10950 12136 12259
Current assets 13796 20661 25275 26987 23479
Inventories 804 1538 2330 2523 1865
Accounts receivable and prepaid expenses 4021 9214 12043 12189 12741
Total cash and other liquid assets 8971 9909 10902 12275 8873
Assets held for sale 89 — — — —
Assets of disposal groups classifi ed
as assets held for sale 5258 — — — —
Total equity 6660 9239 13909 16231 14749
Capital and reserves attributable
to the Company’s equity holders 6468 7937 11866 14384 13088
Non-controlling interests 192 1302 2043 1847 1661
Long-term liabilities 4353 7089 5872 5688 6270
Long-term interest-bearing liabilities 3286 5087 3969 4242 4432
Deferred tax liabilities 195 701 803 1022 1303
Other long-term liabilities 630 997 623 310 330
Provisions 242 304 477 114 205
Current liabilities 9450 13656 16444 17204 14719
Current portion of long-term loans 3192 201 357 116 44
Short-term borrowings and other
fi nancial liabilities 219 351 1478 1368 972
Accounts payable 1842 4394 5532 6101 4950
Accrued expenses and other liabilities 3517 6722 7207 7439 6514
Provisions 680 1988 1870 2180 2239
Liabilities of disposal groups classifi ed
as liabilities held for sale 4728 — — — —
Total assets 25191 29984 36225 39123 35738