Nokia 2013 Annual Report Download - page 9
Download and view the complete annual report
Please find page 9 of the 2013 Nokia annual report below. You can navigate through the pages in the report by either clicking on the pages listed below, or by using the keyword search tool below to find specific information within the annual report.-
 1
1 -
 2
2 -
 3
3 -
 4
4 -
 5
5 -
 6
6 -
 7
7 -
 8
8 -
 9
9 -
 10
10 -
 11
11 -
 12
12 -
 13
13 -
 14
14 -
 15
15 -
 16
16 -
 17
17 -
 18
18 -
 19
19 -
 20
20 -
21
-
22
-
23
-
24
-
25
-
26
-
27
-
28
-
29
-
30
-
31
-
32
-
33
-
34
-
35
-
36
-
37
-
38
-
39
-
40
-
41
-
42
-
43
-
44
-
45
-
46
-
47
-
48
-
49
-
50
-
51
-
52
-
53
-
54
-
55
-
56
-
57
-
58
-
59
-
60
-
61
-
62
-
63
-
64
-
65
-
66
-
67
-
68
-
69
-
70
-
71
-
72
-
73
-
74
-
75
-
76
-
77
-
78
-
79
-
80
-
81
-
82
-
83
-
84
-
85
-
86
-
87
-
88
-
89
-
90
-
91
-
92
-
93
-
94
-
95
-
96
-
97
-
98
-
99
-
100
-
101
-
102
-
103
-
104
-
105
-
106
-
107
-
108
-
109
-
110
-
111
-
112
-
113
-
114
-
115
-
116
-
117
-
118
-
119
-
120
-
121
-
122
-
123
-
124
-
125
-
126
-
127
-
128
-
129
-
130
-
131
-
132
-
133
-
134
-
135
-
136
-
137
-
138
-
139
-
140
-
141
-
142
-
143
-
144
-
145
-
146
 |
 |

REVIEW BY THE BOARD OF DIRECTORS 7
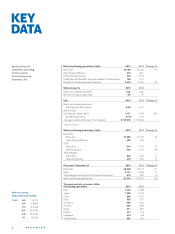
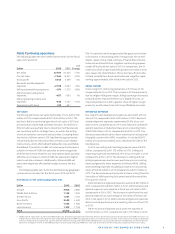
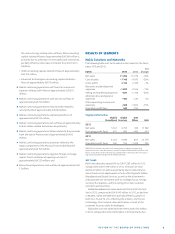
Nokia Continuing operations
The following table sets forth selective line items for the fi scal
years and .
YoY
EURm 2013 2012 Change
Net sales 12 709 15 400 – 17%
Cost of sales – 7 364 – 9 841 – 25%
Gross profi t 5 345 5 559 – 4%
Research and development
expenses – 2 619 – 3 081 – 15%
Selling and marketing expenses – 974 – 1 372 – 29%
Administrative and general
expenses – 697 – 690 1%
Other operating income and
expenses – 536 – 1 237 – 57%
Operating profi t (loss) 519 – 821
NET SALES
Continuing operations net sales declined by % to EUR
million in compared with EUR million in . The
decline in Nokia’s continuing operations’ net sales in was
primarily due to lower NSN and HERE net sales. The decline in
NSN net sales was partially due to divestments of businesses
not consistent with its strategic focus, as well as the exiting
of certain customer contracts and countries. Excluding these
two factors, NSN net sales in declined by approximately
% primarily due to reduced wireless infrastructure deploy-
ment activity, which aff ected both Global Services and Mobile
Broadband. The decline in HERE net sales was primarily due to
a decline in internal HERE net sales due to lower recognition
of deferred revenue related to our smartphone sales, partially
off set by an increase in external HERE net sales due to higher
sales to vehicle customers. Additionally, NSN and HERE net
sales were negatively aff ected by foreign currency fl uctua-
tions.
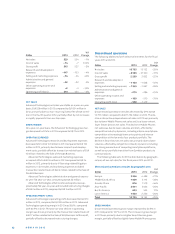
The following table sets forth the distribution by geographi-
cal area of our net sales for the fi scal years and .
Distribution of net sales by geographic area
EURm 2013 2012
Europe 3 940 4 892
Middle East & Africa 1 169 1 362
Greater China 1 201 1 341
Asia-Pacifi c 3 428 4 429
North America 1 656 1 628
Latin America 1 315 1 748
Total 12 709 15 400
The markets in which we generated the greatest net sales
in were, in descending order of magnitude, the United
States, Japan, China, India, Germany, Finland, Brazil, Russia,
Indonesia and Great Britain, together representing approxi-
mately % of total net sales in . In comparison, the
markets in which we generated the greatest net sales in
were Japan, the United States, China, Germany, Brazil, India,
Finland, Great Britain, Russia and Indonesia, together repre-
senting approximately % of total net sales in .
GROSS MARGIN
Gross margin for continuing operations in was .%,
compared to .% in . The increase in was primarily
due to a higher NSN gross margin. NSN gross margin increased
primarily due to improved effi ciency in Global Services, an
improved product mix with a greater share of higher margin
products, and the divestment of less profi table businesses.
OPERATING EXPENSES
Our research and development expenses were EUR mil-
lion in , compared to EUR million in . Research
and development expenses represented .% of our net
sales in , compared to .% in . Research and devel-
opment expenses included purchase price accounting items
of EUR million in , compared to EUR in . The
decrease was primarily due to lower amortization of acquired
intangible assets within HERE. In addition, it included EUR
million of transaction related costs, related to the Sale of the
D&S Business.
In , our selling and marketing expenses were EUR
million, compared to EUR million in . Selling and
marketing expenses represented .% of our net sales in
compared to .% in . The decrease in selling and mar-
keting expenses was due to lower purchase price accounting
items and generally lower expenses in NSN and HERE. Selling
and marketing expenses included purchase price accounting
items of EUR million in compared to EUR million in
. The decrease was primarily due to items arising from the
formation of NSN becoming fully amortized at the end of the
fi rst quarter of .
Administrative and general expenses were EUR million in
, compared to EUR million in . Administrative and
general expenses were equal to .% of our net sales in
compared to .% in . The increase in administrative and
general expenses as a percentage of net sales refl ected a de-
cline in net sales in . Administrative and general expenses
did not include purchase price accounting items in either
or .
Other income and expense was a lower net expense of
EUR million in , compared to EUR million in .
HERE internal sales refers to sales that HERE had to our Discontinued operations (formerly Devices & Services business) that used certain HERE services in its
mobile devices. After the closing of the Sale of the D&S Business HERE no longer generates such internal sales, however it will continue to recognize deferred
revenue related to this business for up to months after the closing of the Sale of the D&S Business. As part of the Sale of the D&S Business, Microsoft will
become a strategic licensee of the HERE platform, and will separately pay HERE for a four-year license that will be recognized ratably as external net sales.