Nokia 2013 Annual Report Download - page 26
Download and view the complete annual report
Please find page 26 of the 2013 Nokia annual report below. You can navigate through the pages in the report by either clicking on the pages listed below, or by using the keyword search tool below to find specific information within the annual report.
NOKIA IN 2013
24
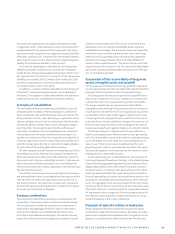
CONSOLIDATED STATEMENTS
OF FINANCIAL POSITION, IFRS
2013
December 31 Notes EURm EURm
ASSETS
Non-current assets
Goodwill 14 3295 4876
Other intangible assets 14 296 647
Property, plant and equipment 15 566 1 431
Investments in associated companies 16 65 58
Available-for-sale investments 17 741 689
Deferred tax assets 26 890 1 279
Long-term loans receivable 17,35 96 125
Other non-current assets 99 218
6048 9323
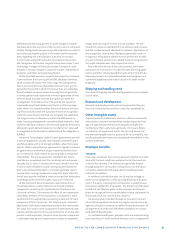
Current assets
Inventories 19, 21 804 1 538
Accounts receivable, net of allowances for doubtful accounts
(2013: EUR 124million, 2012:EUR 248 million) 17, 21, 35 2901 5 551
Prepaid expenses and accrued income 20 660 2 682
Current income tax assets 146 495
Current portion of long-term loans receivable 17, 35 29 35
Other fi nancial assets 17,18,35 285 451
Investments at fair value through profi t and loss, liquid assets 17, 35 382 415
Available-for-sale investments, liquid assets 17, 35 956 542
Available-for-sale investments, cash equivalents 17, 35 3957 5 448
Bank and cash 35 3676 3 504
13796 20661
Assets held for sale 15, 17 89 —
Assets of disposal groups classifi ed as held for sale 3 5258 —
Total assets 25 191 29 984
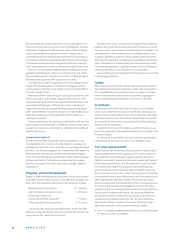
SHAREHOLDERS’ EQUITY AND LIABILITIES
Capital and reserves attributable to equity holders of the parent
Share capital 24 246 246
Share issue premium 615 446
Treasury shares, at cost – 603 – 629
Translation diff erences 23 434 746
Fair value and other reserves 22 80 – 5
Reserve for invested non-restricted equity 3 115 3136
Retained earnings 2 581 3997
6 468 7937
Non-controlling interests 192 1302
Total equity 6 660 9239
Non-current liabilities
Long-term interest-bearing liabilities 17, 35 3 286 5 087
Deferred tax liabilities 26 195 701
Other long-term liabilities 630 997
Provisions 28 242 304
4 353 7089
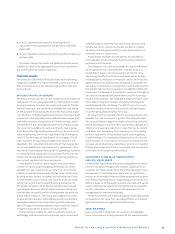
Current liabilities
Current portion of long-term loans 17, 35 3 192 201
Short-term borrowings 17, 35 184 261
Other fi nancial liabilities 17, 18, 35 35 90
Current income tax liabilities 13 484 499
Accounts payable 17,35 1842 4394
Accrued expenses and other liabilities 27 3033 6223
Provisions 28 680 1988
9 450 13 656
Liabilities of disposal groups classifi ed as held for sale 3 4 728 —
Total shareholders’ equity and liabilities 25 191 29 984
* December , reflects the retrospective application of Revised IAS , Employee Benefits.
See Notes to Consolidated Financial Statements.
2012 *


