Nokia 2013 Annual Report Download - page 76
Download and view the complete annual report
Please find page 76 of the 2013 Nokia annual report below. You can navigate through the pages in the report by either clicking on the pages listed below, or by using the keyword search tool below to find specific information within the annual report.-
 1
1 -
2
-
3
-
4
-
5
-
6
-
7
-
8
-
9
-
10
-
11
-
12
-
13
-
14
-
15
-
16
-
17
-
18
-
19
-
20
-
21
-
22
-
23
-
24
-
25
-
26
-
27
-
28
-
29
-
30
-
31
-
32
-
33
-
34
-
35
-
36
-
37
-
38
-
39
-
40
-
41
-
42
-
43
-
44
-
45
-
46
-
47
-
48
-
49
-
50
-
51
-
52
-
53
-
54
-
55
-
56
-
57
-
58
-
59
-
60
-
61
-
62
-
63
-
64
-
65
-
 66
66 -
 67
67 -
 68
68 -
 69
69 -
 70
70 -
 71
71 -
 72
72 -
 73
73 -
 74
74 -
 75
75 -
 76
76 -
 77
77 -
 78
78 -
 79
79 -
 80
80 -
 81
81 -
 82
82 -
 83
83 -
 84
84 -
 85
85 -
 86
86 -
87
-
88
-
89
-
90
-
91
-
92
-
93
-
94
-
95
-
96
-
97
-
98
-
99
-
100
-
101
-
102
-
103
-
104
-
105
-
106
-
107
-
108
-
109
-
110
-
111
-
112
-
113
-
114
-
115
-
116
-
117
-
118
-
119
-
120
-
121
-
122
-
123
-
124
-
125
-
126
-
127
-
128
-
129
-
130
-
131
-
132
-
133
-
134
-
135
-
136
-
137
-
138
-
139
-
140
-
141
-
142
-
143
-
144
-
145
-
146
 |
 |

NOKIA IN 2013
74
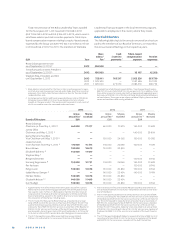
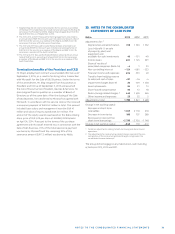
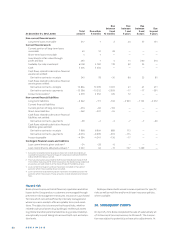
2013, EURm USD JPY CNY INR
FX derivatives used as
cashfl ow hedges
(net amount) 1 – 409 – 232 — —
FX derivatives used as
net investment hedges
(net amount) 2 – 724 – 14 – 358 – 157
FX exposure from
balance sheet items
(net amount) 3 – 217 36 – 47 – 141
FX derivatives not
designated in a hedge
relationship and carried
at fair value through
profi t and loss
(net amount) 3 – 367 – 116 81 57
Cross currency / interest
rate hedges 390 — — —
2012, EURm USD JPY CNY INR
FX derivatives used as
cashfl ow hedges
(net amount) 1 550 – 281 — —
FX derivatives used as
net investment hedges
(net amount) 2 – 281 – 16 – 1043 – 763
FX exposure from
balance sheet items
(net amount) 3 1 156 38 263 – 539
FX derivatives not
designated in a hedge
relationship and carried
at fair value through
profi t and loss
(net amount) 3 – 1439 106 – 114 420
Cross currency / interest
rate hedges 428 — — —
The FX derivatives are used to hedge the foreign exchange risk from fore-
cast highly probable cashflows related to sales, purchases and business
acquisition activities. In some of the currencies, especially in US dollar,
Nokia has substantial foreign exchange risks in both estimated cash
inflows and outflows, which have been netted in the table. The underlying
exposures for which these hedges are entered into are not presented in
the table, as they are not financial instruments.
The FX derivatives are used to hedge the Group’s net investment expo-
sure. The underlying exposures for which these hedges are entered into
are not presented in the table, as they are not financial instruments.
The balance sheet items and some probable forecast cash flows which
are denominated in foreign currencies are hedged by a portion of FX
derivatives not designated in a hedge relationship and carried at fair value
through profit and loss.
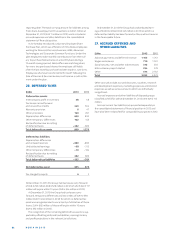
The VaR fi gures for the Group’s fi nancial instruments which
are sensitive to foreign exchange risks are presented in the
table below. The VaR calculation includes foreign currency
denominated monetary fi nancial instruments such as:
■ Available-for-sale investments, loans and accounts receiv-
able, investments at fair value through profi t and loss, cash,
loans and accounts payable.
■ FX derivatives carried at fair value through profi t and loss
which are not in a hedge relationship and are mostly used
for hedging balance sheet foreign exchange exposure.
■ FX derivatives designated as forecasted cash fl ow hedges
and net investment hedges. Most of the VaR is caused by
these derivatives as forecasted cash fl ow and net invest-
ment exposures are not fi nancial instruments as defi ned
under IFRS and thus not included in the VaR calculation.
VaR from fi nancial instruments, EURm 2013 2012
At December 31 42 67
Average for the year 114 128
Range for the year 42 – 188 67 – 192
Interest rate risk
The Group is exposed to interest rate risk either through
market value fl uctuations of balance sheet items (i.e. price risk)
or through changes in interest income or expenses (i.e. refi -
nancing or reinvestment risk). Interest rate risk mainly arises
through interest bearing liabilities and assets. Estimated
future changes in cash fl ows and balance sheet structure also
expose the Group to interest rate risk.
The objective of interest rate risk management is to balance
uncertainty caused by fl uctuations in interest rates and net
long-term funding costs.
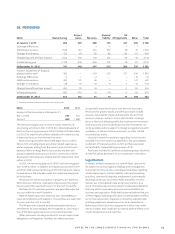
At the reporting date, the interest rate profi le of the
Group’s interest-bearing assets and liabilities is presented in
the table below:
2013 2012
Fixed Floating Fixed Floating
EURm rate rate rate rate
Assets 4 400 4 739 3 488 6 627
Liabilities – 5947 – 630 – 4191 – 1312
Assets and liabilities
before derivatives – 1547 4109 – 703 5315
Interest rate
derivatives 954 – 926 1880 – 1784
Assets and liabilities
after derivatives – 593 3183 1177 3531
The interest rate exposure of the Group is monitored and
managed centrally. Nokia uses the VaR methodology com-
plemented by selective shock sensitivity analyses to assess
and measure the interest rate risk of interest-bearing assets,
interest-bearing liabilities and related derivatives, which
together create the Group’s interest rate exposure. The VaR
for the Group interest rate exposure in the investment and
debt portfolios is presented in the table below. Sensitivities to
credit spreads are not refl ected in the below numbers.
‘
EURm 2013 2012
At December31 42 22
Average for the year 45 19
Range for the year 20 – 84 9 – 44
Equity price risk
Nokia’s exposure to equity price risk is related to certain pub-
licly listed equity shares.
The fair value of these investments at December ,
was EUR million (EUR million in ). The VaR for the
Group equity investment in publicly traded companies is insig-
nifi cant. The private funds where the Group has investments