IBM 2008 Annual Report Download - page 89
Download and view the complete annual report
Please find page 89 of the 2008 IBM annual report below. You can navigate through the pages in the report by either clicking on the pages listed below, or by using the keyword search tool below to find specific information within the annual report.-
 1
1 -
2
-
3
-
4
-
5
-
6
-
7
-
8
-
9
-
10
-
11
-
12
-
13
-
14
-
15
-
16
-
17
-
18
-
19
-
20
-
21
-
22
-
23
-
24
-
25
-
26
-
27
-
28
-
29
-
30
-
31
-
32
-
33
-
34
-
35
-
36
-
37
-
38
-
39
-
40
-
41
-
42
-
43
-
44
-
45
-
46
-
47
-
48
-
49
-
50
-
51
-
52
-
53
-
54
-
55
-
56
-
57
-
58
-
59
-
60
-
61
-
62
-
63
-
64
-
65
-
66
-
67
-
68
-
69
-
70
-
71
-
72
-
73
-
74
-
75
-
76
-
77
-
78
-
 79
79 -
 80
80 -
 81
81 -
 82
82 -
 83
83 -
 84
84 -
 85
85 -
 86
86 -
 87
87 -
 88
88 -
 89
89 -
 90
90 -
 91
91 -
 92
92 -
 93
93 -
 94
94 -
 95
95 -
 96
96 -
 97
97 -
 98
98 -
 99
99 -
100
-
101
-
102
-
103
-
104
-
105
-
106
-
107
-
108
-
109
-
110
-
111
-
112
-
113
-
114
-
115
-
116
-
117
-
118
-
119
-
120
-
121
-
122
-
123
-
124
-
125
-
126
-
127
-
128
 |
 |

Notes to Consolidated Financial Statements
INTERNATIONAL BUSINESS MACHINES CORPORATION and Subsidiary Companies
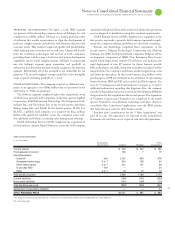
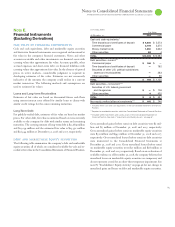
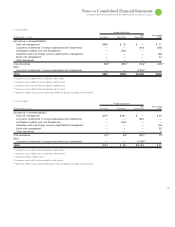
Note I.
Investments and Sundry Assets
($ )
At December : 2008 2007*
Deferred transition and setup costs
and other deferred arrangements**
$1,548 $1,475
Derivatives — noncurrent
+ 1,117 259
Alliance investments:
Equity method 167 271
Non-equity method 285 879
Prepaid software 370 221
Long-term deposits 277 285
Marketable securities 6531
Other assets 1,289 1,327
TOTAL $5,058 $5,248
* Reclassified to conform with 2008 presentation of deferred taxes, previously combined
in investments and sundry assets.
** Deferred transition and setup costs and other deferred arrangements are related to
Global Services client arrangements. Also see note A, “Significant Accounting Policies,”
on pages 68 and 69 for additional information.
+ See note L, “Derivatives and Hedging Transactions,” on pages 90 to 94 for the fair
value of all derivatives reported in the Consolidated Statement of Financial Position.
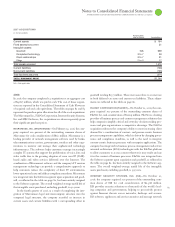
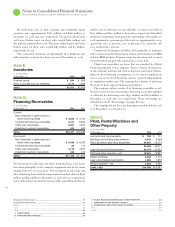
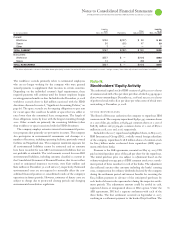
Note J.
Intangible Assets Including Goodwill
The following table details the company’s intangible asset balances
by major asset class.
($ )
At December 31, 2008
Gross Net
Carrying Accumulated Carrying
Intangible Asset Class Amount Amortization Amount
Capitalized software $1,861 $ (839) $1,022
Client-related 1,532 (663) 869
Completed technology 1,167 (327) 840
Strategic alliances — — —
Patents/trademarks 188 (76) 112
Other* 154 (121) 35
TOTAL $4,901 $(2,023) $2,878
* Other intangibles are primarily acquired proprietary and nonproprietary business
processes, methodologies and systems, and impacts from currency translation.
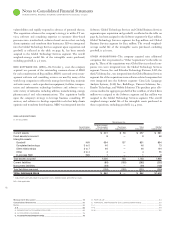
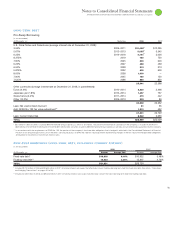
($ )
At December 31, 2007
Gross Net
Carrying Accumulated Carrying
Intangible Asset Class Amount Amortization Amount
Capitalized software $1,926 $ (826) $1,100
Client-related 1,054 (495) 559
Completed technology 536 (194) 342
Strategic alliances 103 (103) —
Patents/trademarks 128 (61) 67
Other* 154 (115) 39
TOTAL $3,901 $(1,794) $2,107
* Other intangibles are primarily acquired proprietary and nonproprietary business
processes, methodologies and systems, and impacts from currency translation.
The company amortizes intangible assets over their estimated useful
lives unless such lives are deemed indefinite. Amortizable intangible
assets are tested for impairment based on undiscounted cash flows,
and, if impaired, written down to fair value based on either discounted
cash flows or appraised values. Intangible assets with indefinite lives
are tested annually for impairment and written down to fair value as
required. No impairment of intangible assets has been recorded dur-
ing any of the periods presented.
The net carrying amount of intangible assets increased by $
million for the year ended December , , primarily due to acqui-
sitions of intangibles offset by amortization.
Total amortization was $, million and $, million for the
years ended December , and , respectively. The aggregate
amortization expense for acquired intangibles (excluding capitalized
software) was $ million and $ million for the years ended
December , and , respectively. In addition, in the
company retired $, million of fully amortized intangible assets,
impacting both the gross carrying amount and accumulated amorti-
zation for this amount.
The future amortization expense for each of the five succeeding
years related to all intangible assets that are currently recorded in the
Consolidated Statement of Financial Position is estimated to be as
follows at December , :
Capitalized Acquired
($ ) Software Intangibles Total
2009 $634 $500 $1,135
2010 314 407 722
2011 74 358 432
2012 — 290 290
2013 — 211 211