IBM 2008 Annual Report Download - page 118
Download and view the complete annual report
Please find page 118 of the 2008 IBM annual report below. You can navigate through the pages in the report by either clicking on the pages listed below, or by using the keyword search tool below to find specific information within the annual report.-
 1
1 -
2
-
3
-
4
-
5
-
6
-
7
-
8
-
9
-
10
-
11
-
12
-
13
-
14
-
15
-
16
-
17
-
18
-
19
-
20
-
21
-
22
-
23
-
24
-
25
-
26
-
27
-
28
-
29
-
30
-
31
-
32
-
33
-
34
-
35
-
36
-
37
-
38
-
39
-
40
-
41
-
42
-
43
-
44
-
45
-
46
-
47
-
48
-
49
-
50
-
51
-
52
-
53
-
54
-
55
-
56
-
57
-
58
-
59
-
60
-
61
-
62
-
63
-
64
-
65
-
66
-
67
-
68
-
69
-
70
-
71
-
72
-
73
-
74
-
75
-
76
-
77
-
78
-
79
-
80
-
81
-
82
-
83
-
84
-
85
-
86
-
87
-
88
-
89
-
90
-
91
-
92
-
93
-
94
-
95
-
96
-
97
-
98
-
99
-
100
-
101
-
102
-
103
-
104
-
105
-
106
-
107
-
 108
108 -
 109
109 -
 110
110 -
 111
111 -
 112
112 -
 113
113 -
 114
114 -
 115
115 -
 116
116 -
 117
117 -
 118
118 -
 119
119 -
 120
120 -
 121
121 -
 122
122 -
 123
123 -
 124
124 -
 125
125 -
 126
126 -
 127
127 -
 128
128
 |
 |

Notes to Consolidated Financial Statements
INTERNATIONAL BUSINESS MACHINES CORPORATION and Subsidiary Companies
Management Discussion ............................................................................................. 18
Consolidated Statements ............................................................................................ 60
Notes ............................................................................................................................... 66
A – E ........................................................................................................................66
F – J ........................................................................................................................86
K– Q .......................................................................................................................88
R –W ..................................................................................................................... 102
R. EARNINGS PER SHARE OF COMMON STOCK .............................................. 102
S. RENTAL EXPENSE AND LEASE COMMITMENTS ........................................... 10 3
T. STOCK-BASED COMPENSATION ................................................................... 103
U. RETIREMENT-RELATED BENEFITS ............................................................... 106
V. SEGMENT INFORMATION .............................................................................. 116
W. SUBSEQUENT EVENT .................................................................................... 119
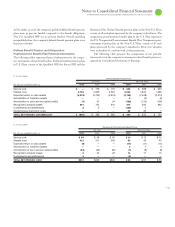
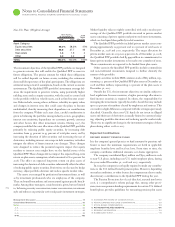
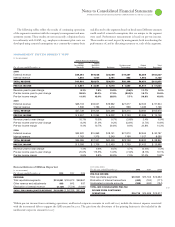
($ )
2008 2007
Benefit Benefit
At December : Obligation Plan Assets Obligation Plan Assets
Plans with PBO in excess of plan assets $75,341 $60,898 $14,472 $ 5,980
Plans with ABO in excess of plan assets 73,939 60,630 13,607 5,687
Plans with assets in excess of PBO 12,586 14,183 75,491 92,908
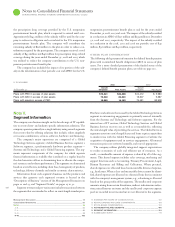
Note V.
Segment Information
The company uses business insight and its broad range of IT capabili-
ties to create client- and industry-specific information solutions. The
company operates primarily in a single industry using several segments
that create value by offering solutions that include, either singularly
or in some combination, services, software, hardware and financing.
The company’s major operations are comprised of a Global
Tech nol ogy Services segment; a Global Business Services segment; a
Software segment; a predominantly hardware product segment —
Systems and Technology; and a Global Financing segment. The seg-
ments repre sent components of the company for which separate
financial information is available that is utilized on a regular basis by
the chief executive officer in determining how to allocate the compa-
ny’s resources and evaluate performance. The segments are determined
based on several factors, including client base, homogeneity of products,
technology, delivery channels and similar economic characteristics.
Information about each segment’s business and the products and
services that generate each segment’s revenue is located in the
“Description of Business” section of the Management Discussion on
pages and , and “Segment Details,” on pages to .
Segment revenue and pre-tax income include transactions between
the segments that are intended to reflect an arm’s-length transfer price.
Hardware and software that is used by the Global Technology Services
segment in outsourcing engagements is primarily sourced internally
from the Systems and Technology and Software segments. For the
internal use of IT services, Global Technology Services and Global
Business Services recover cost, as well as a reasonable fee, reflecting
the arm’s-length value of providing the services. The Global Services
segments enter into arm’s-length leases and loans at prices equivalent
to market rates with the Global Financing segment to facilitate the
acquisition of equipment used in services engagements. All internal
transaction prices are reviewed annually, and reset if appropriate.
The company utilizes globally integrated support organizations
to realize economies of scale and efficient use of resources. As a
result, a considerable amount of expense is shared by all of the seg-
ments. This shared expense includes sales coverage, marketing and
support functions such as Accounting, Treasury, Procurement, Legal,
Human Re sources and Billing and Collections. Where practical,
shared expenses are allocated based on measurable drivers of expense,
e.g., headcount. When a clear and measurable driver cannot be identi-
fied, shared expenses are allocated on a financial basis that is consistent
with the company’s management system; e.g., advertising is allocated
based on the gross profits of the segments. The unallocated corporate
amounts arising from certain divestitures, indirect infrastructure reduc-
tions, miscellaneous tax items and the unallocated corporate expense
pool are recorded in net income but are not allocated to the segments.
the prescription drug coverage provided by the U.S. nonpension
postretirement benefit plan, which is expected to extend until .
Approx imately $ million of the subsidy will be used by the com-
pany to reduce its obligation and cost related to the U.S. nonpension
postretirement benefit plan. The company will contribute the
remain
ing subsidy of $ million to the plan in order to reduce con-
tributions
required by the participants. The company received a total
subsidy of $ million and $ million for prescription drug-related
coverage during the years ended December , and , which
was utilized to reduce the company contributions to the U.S. non-
pension postretirement benefit plan.
The company has included the impact of its portion of the sub-
sidy in the determination of net periodic cost and APBO for the U.S.
nonpension postretirement benefit plan at and for the years ended
December , , and . The impact of the subsidy resulted
in a reduction in APBO of $ million and $ million at December
, and , respectively. The impact of the subsidy resulted
in a reduction in the , and net periodic cost of $
million, $ million and $ million, respectively.
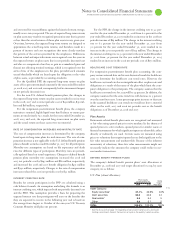
The following table presents information for defined benefit pension
plans with accumulated benefit obligations (ABO) in excess of plan
assets. For a more detailed presentation of the funded status of the
company’s defined benefit pension plans, see table on page .