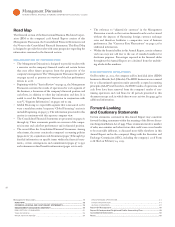
IBM 2008 Annual Report Download - page 14
Download and view the complete annual report
Please find page 14 of the 2008 IBM annual report below. You can navigate through the pages in the report by either clicking on the pages listed below, or by using the keyword search tool below to find specific information within the annual report.-
 1
1 -
2
-
3
-
 4
4 -
 5
5 -
 6
6 -
 7
7 -
 8
8 -
 9
9 -
 10
10 -
 11
11 -
 12
12 -
 13
13 -
 14
14 -
 15
15 -
 16
16 -
 17
17 -
 18
18 -
 19
19 -
 20
20 -
 21
21 -
 22
22 -
 23
23 -
 24
24 -
25
-
26
-
27
-
28
-
29
-
30
-
31
-
32
-
33
-
34
-
35
-
36
-
37
-
38
-
39
-
40
-
41
-
42
-
43
-
44
-
45
-
46
-
47
-
48
-
49
-
50
-
51
-
52
-
53
-
54
-
55
-
56
-
57
-
58
-
59
-
60
-
61
-
62
-
63
-
64
-
65
-
66
-
67
-
68
-
69
-
70
-
71
-
72
-
73
-
74
-
75
-
76
-
77
-
78
-
79
-
80
-
81
-
82
-
83
-
84
-
85
-
86
-
87
-
88
-
89
-
90
-
91
-
92
-
93
-
94
-
95
-
96
-
97
-
98
-
99
-
100
-
101
-
102
-
103
-
104
-
105
-
106
-
107
-
108
-
109
-
110
-
111
-
112
-
113
-
114
-
115
-
116
-
117
-
118
-
119
-
120
-
121
-
122
-
123
-
124
-
125
-
126
-
127
-
128
 |
 |
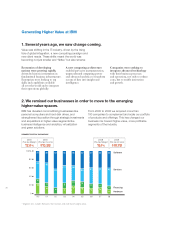
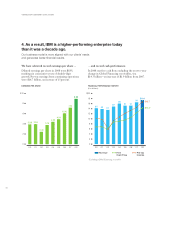
4. As a result, IBM is a higher-performing enterprise today
than it was a decade ago.
Our business model is more aligned with our clients’ needs
and generates better financial results.
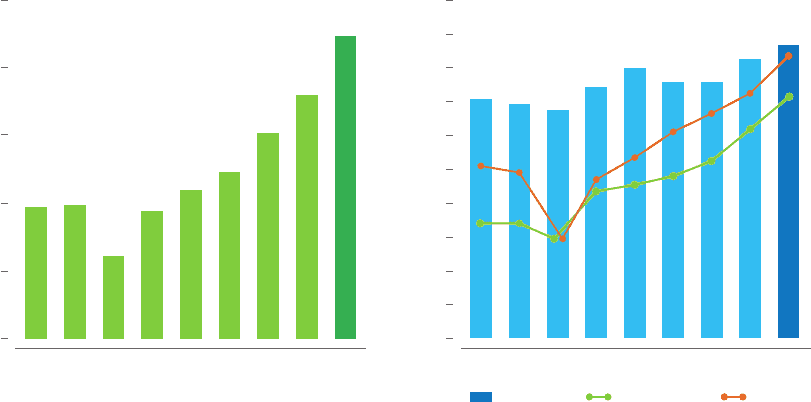
We have achieved record earnings per share …
Diluted earnings per share in 2008 were $8.93,
marking six consecutive years of double-digit
growth. Pre-tax earnings from continuing operations
were $16.7 billion, an increase of 15 percent.
… and record cash performance.
In 2008 our free cash ow, excluding the year-to-year
change in Global Financing receivables, was
$14.3 billion
—
an increase of $1.9 billion from 2007.
EARNINGS PER SHARE
$20
18
14
10
6
2
16
12
8
4
0
$104
99
9191
96
89
81
83
85
Pre-tax
Income
Free
Cash Flow
Revenue
080706050403020100
$14.3*
$16.7
08
0706050403020100
8.93
7.18
6.06
4.91
4.39
3.76
2.43
3.94
3.88
$10
8
6
4
2
0
* Excluding Global Financing receivables
FINANCIAL PERFORMANCE HISTORY
($ in billions)
GENERATING HIGHER VA LUE AT IBM