IBM 2008 Annual Report Download - page 32
Download and view the complete annual report
Please find page 32 of the 2008 IBM annual report below. You can navigate through the pages in the report by either clicking on the pages listed below, or by using the keyword search tool below to find specific information within the annual report.-
 1
1 -
2
-
3
-
4
-
5
-
6
-
7
-
8
-
9
-
10
-
11
-
12
-
13
-
14
-
15
-
16
-
17
-
18
-
19
-
20
-
21
-
 22
22 -
 23
23 -
 24
24 -
 25
25 -
 26
26 -
 27
27 -
 28
28 -
 29
29 -
 30
30 -
 31
31 -
 32
32 -
 33
33 -
 34
34 -
 35
35 -
 36
36 -
 37
37 -
 38
38 -
 39
39 -
 40
40 -
 41
41 -
 42
42 -
43
-
44
-
45
-
46
-
47
-
48
-
49
-
50
-
51
-
52
-
53
-
54
-
55
-
56
-
57
-
58
-
59
-
60
-
61
-
62
-
63
-
64
-
65
-
66
-
67
-
68
-
69
-
70
-
71
-
72
-
73
-
74
-
75
-
76
-
77
-
78
-
79
-
80
-
81
-
82
-
83
-
84
-
85
-
86
-
87
-
88
-
89
-
90
-
91
-
92
-
93
-
94
-
95
-
96
-
97
-
98
-
99
-
100
-
101
-
102
-
103
-
104
-
105
-
106
-
107
-
108
-
109
-
110
-
111
-
112
-
113
-
114
-
115
-
116
-
117
-
118
-
119
-
120
-
121
-
122
-
123
-
124
-
125
-
126
-
127
-
128
 |
 |

Management Discussion
INTERNATIONAL BUSINESS MACHINES CORPORATION and Subsidiary Companies
Management Discussion ................................................................................................18
ROAD MAP ............................................................................................................ 18
FORWARD-LOOKING AND CAUTIONARY STATEMENTS ...................................... 18
MANAGEMENT DISCUSSION SNAPSHOT ............................................................ 19
DESCRIPTION OF BUSINESS................................................................................ 20
YEAR IN REVIEW ..................................................................................................25
PRIOR YEAR IN REVIEW .......................................................................................39
DISCONTINUED OPERATIONS ..............................................................................44
OTHER INFORMATION ..........................................................................................44
GLOBAL FINANCING .............................................................................................53
Report Of Management ............................................................................................... 58
Report Of Independent Registered Public Accounting Firm ................................. 59
Consolidated Statements ............................................................................................ 60
Notes ............................................................................................................................... 66
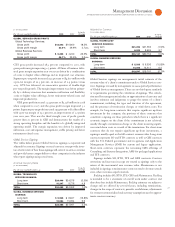
Overall, gross margin decreased by . points versus the prior year.
This decrease was primarily driven by margin declines in System z,
System x and Microelectronics OEM which impacted the overall
margin by . points, . points and . points, respectively. Partially
offsetting these margin declines was a revenue mix benefit of . points
due to the increased revenue in System z and converged System p.
Systems and Technology segment pre-tax margin declined .
points to . percent in reflecting the lower revenue and gross
profit margin in versus .
GLOBAL FINANCING
See pages and for an analysis of Global Financing’s segment
results.
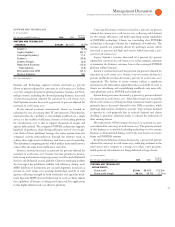
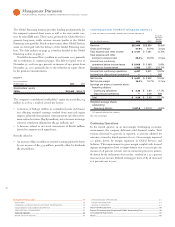
GEOGRAPHIC REVENUE
In addition to the revenue presentation by reportable segment, the
company also measures revenue performance on a geographic basis.
The following geographic, regional and country-specific revenue
performance discussion excludes OEM revenue, which is presented
separately.
($ )
Yr.-to -Yr.
For the year ended December : 2008 2007 Change
TOTAL REVENUE: $103,630 $98,786 4.9%
Geographies: $100,939 $95,320 5.9%
Americas 42,807 41,122 4.1
Europe/Middle East/Africa 37,020 34,699 6.7
Asia Pacific 21,111 19,501 8.3
OEM $ 2,691 $ 3,465 (22.4)%
Geographic revenue increased . percent ( percent adjusted for cur-
rency) to $, million in when compared to . Revenue
increased in all geographies in , and adjusted for currency, revenue
growth was strongest in the Americas followed by Europe and Asia
Pacific. Revenue from the company’s growth markets organization
increased . percent ( percent adjusted for currency) while growth
in the more established major markets was . percent ( percent
adjusted for currency).
Americas revenue increased . percent ( percent adjusted for
currency) in . Revenue increased in all regions with the U.S. up
. percent, Canada . percent ( percent adjusted for currency) and
Latin America . percent ( percent adjusted for currency).
Europe/Middle East/Africa (EMEA) revenue increased . per-
cent ( percent adjusted for currency) in when compared to .
The majority of major market countries performed well led by Spain
which grew . percent ( percent adjusted for currency), Germany
increased . percent ( percent adjusted for currency) and France
increased . percent ( percent adjusted for currency). Italy increased
. percent (decreased percent adjusted for currency) while the U.K.
decreased . percent (increased percent adjusted for currency).
Asia Pacific revenue increased . percent ( percent adjusted for
currency) year over year. Revenue increased in the India, South Korea,
ASEAN, Australia/New Zealand and China regions with combined
growth of . percent ( percent adjusted for currency). Japan reve-
nue, which represented percent of the Asia Pacific revenue base,
increased . percent as reported, but decreased percent adjusted
for currency in when compared to .
Across the geographies, aggregate revenue from the countries
comprising the company’s growth markets organization increased
. percent ( percent adjusted for currency) in and represented
approximately percent of the company’s total geographic revenue.
The company has continued to invest to capture new infrastructure
spending in the growth markets. Adjusted for currency, growth in
these markets was points higher than in the major markets. The
BRIC countries, a subset of the growth markets, together grew
. percent ( percent adjusted for currency), with growth in India
of . percent ( percent adjusted for currency), Brazil . percent
( percent adjusted for currency), China . percent ( percent
adjusted for currency) and Russia . percent ( percent adjusted
for currency).
OEM revenue decreased . percent ( percent adjusted for
currency) in when compared to , driven by reduced demand
in the Microelectronics OEM business.
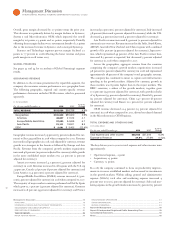
TOTAL EXPENSE AND OTHER INCOME
($ )
Yr.-to -Yr.
For the year ended December : 2008 2007 Change
Total expense and other income $28,945 $27,240 6.3%
Expense to Revenue 27.9% 27.6% 0.4 pts.
The key drivers year to year in total expense and other income were
approximately:
• Operational expense, - point
• Acquisitions, + points
• Currency, + points
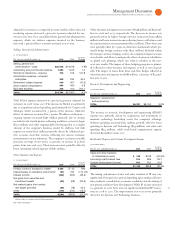
In , the company continued to focus on productivity improve-
ments in its more established markets and increased its investments
in the growth markets. Within selling, general and administrative
expense (SG&A), total sales and marketing expense increased
percent year to year ( percent adjusted for currency). Sales and mar-
keting expense in the growth markets increased percent ( percent