IBM 2008 Annual Report Download - page 46
Download and view the complete annual report
Please find page 46 of the 2008 IBM annual report below. You can navigate through the pages in the report by either clicking on the pages listed below, or by using the keyword search tool below to find specific information within the annual report.-
 1
1 -
2
-
3
-
4
-
5
-
6
-
7
-
8
-
9
-
10
-
11
-
12
-
13
-
14
-
15
-
16
-
17
-
18
-
19
-
20
-
21
-
22
-
23
-
24
-
25
-
26
-
27
-
28
-
29
-
30
-
31
-
32
-
33
-
34
-
35
-
 36
36 -
 37
37 -
 38
38 -
 39
39 -
 40
40 -
 41
41 -
 42
42 -
 43
43 -
 44
44 -
 45
45 -
 46
46 -
 47
47 -
 48
48 -
 49
49 -
 50
50 -
 51
51 -
 52
52 -
 53
53 -
 54
54 -
 55
55 -
 56
56 -
57
-
58
-
59
-
60
-
61
-
62
-
63
-
64
-
65
-
66
-
67
-
68
-
69
-
70
-
71
-
72
-
73
-
74
-
75
-
76
-
77
-
78
-
79
-
80
-
81
-
82
-
83
-
84
-
85
-
86
-
87
-
88
-
89
-
90
-
91
-
92
-
93
-
94
-
95
-
96
-
97
-
98
-
99
-
100
-
101
-
102
-
103
-
104
-
105
-
106
-
107
-
108
-
109
-
110
-
111
-
112
-
113
-
114
-
115
-
116
-
117
-
118
-
119
-
120
-
121
-
122
-
123
-
124
-
125
-
126
-
127
-
128
 |
 |

Management Discussion
INTERNATIONAL BUSINESS MACHINES CORPORATION and Subsidiary Companies
Management Discussion ................................................................................................18
ROAD MAP ............................................................................................................ 18
FORWARD-LOOKING AND CAUTIONARY STATEMENTS ...................................... 18
MANAGEMENT DISCUSSION SNAPSHOT ............................................................ 19
DESCRIPTION OF BUSINESS................................................................................ 20
YEAR IN REVIEW ...................................................................................................25
PRIOR YEAR IN REVIEW ......................................................................................39
DISCONTINUED OPERATIONS ............................................................................. 44
OTHER INFORMATION ..........................................................................................44
GLOBAL FINANCING .............................................................................................53
Report Of Management ............................................................................................... 58
Report Of Independent Registered Public Accounting Firm ................................. 59
Consolidated Statements ............................................................................................ 60
Notes ............................................................................................................................... 66
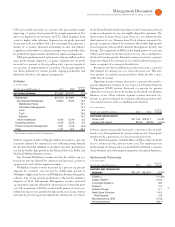
Stockholders’ equity of $, million was essentially flat versus
. Increased treasury stock ($, million) from share repur-
chases, which included the ASR, was largely offset by increased retained
earnings ($, million) driven by net income, increased common
stock ($, million) related to stock options and a decline in accu-
mulated gains and
(l
osses) not affecting retained earnings ($,
million) primarily due to the effects of pension remeasurements.
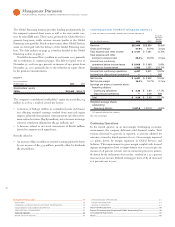
The company generated $, million in cash flow provided by
operating activities, an increase of $, million compared to ,
primarily driven by increased net income. Net cash used in investing
activities of $, million was $, million lower than driven
primarily by proceeds from disposition of short-term marketable
securities and a reduction in cash used for acquisitions. Net cash
used in financing activities of $, million decreased $, mil-
lion versus driven by increased net proceeds from total debt
($, million), partially offset by increased share repurchases
($, million).
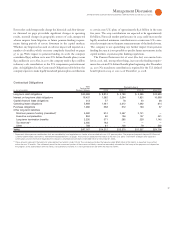
Discontinued Operations
On December , , the company sold its HDD business to Hitachi
for approximately $ billion. The final cash payment of $ million
was received on December , .
In , the company reported net income of $ million, net of
tax, primarily related to tax benefits from tax audit settlements.
Other Information
Looking forward, the company enters in an excellent operational
and financial position. The company has shifted its business to higher
value services and software, with less dependence on commoditizing
and cyclical businesses. The Global Services business in con-
tributed percent of total segment pre-tax income and managed
over percent of the company’s resources. The company’s software
capabilities have grown through internal investment and acquisitions
with Software segment pre-tax profit more than doubling in the
past five years to over $ billion in . In , over percent
of segment pre-tax profit came from Global Services and Software,
and over percent from Global Services, Software and Global
Financing. The company has changed the profile of the business to
make it more adaptable to different business environments.
The company enters and the current market from a position
of strength. The company will take advantage of the environment to
continue to execute its strategies.
The company has a significant global presence, operating in over
countries, with approximately percent of its revenue generated
outside the U.S. This global reach gives the company access to mar-
kets, with well-established organizations and management systems
who understand the clients and their challenges and who can respond
to these opportunities with value-add solutions. The company’s trans-
formation to a globally integrated enterprise provides the capabilities
to service clients globally and deliver the best skills and cost from
anywhere in the world.
In emerging markets, the company will continue to invest for
revenue growth by capturing new infrastructure spending in these
markets. While some of these economies have slowed, these markets
still offer good growth opportunities relative to the rest of the world.
The company has developed a strong value proposition for the
established markets based on cost reduction, capital conservation and
risk management. The high value, integrated offerings, including green
data centers, outsourcing and virtualization on high-end systems, have
performed well in these markets in the current environment.
Looking forward, the company’s “Smarter Planet” agenda will
provide an important new opportunity to deliver value to clients.
The company anticipates a significant opportunity in “smart infra-
structure” projects as governments around the world implement
economic stimulus programs focused on next generation smart
grids, healthcare-related information technology and broadband.
Projects of these types require technology integration and industry
insight which should uniquely position the company to participate
in these opportunities.
The company remains committed to technology leadership and
will continue to focus internal investments, complemented with
strategic acquisitions, on high-value, high-growth opportunities. The
company invested over $ billion in RD&E in and approxi-
mately $ billion over the past five years.
In addition, the company’s financial position is strong. Through its
efficient cash generation business model based on disciplined balance
sheet management, in , the company generated $. billion in
operating cash flow and ended the year with $. billion in cash and
marketable securities. This provides the company with the financial
flexibility for investments in changing business environments. The
company will also continue to focus on cost and expense reduction
and improved efficiency. In , those efforts translated to margin
expansion and the company expects this to continue into .
In May , the company met with investors and analysts and
discussed a road map to deliver earnings per share in in the
range of $ to $ per share, or to percent compound growth
rate from . The company’s road map is to generate earn-
ings per share in the range of $ to $ per share, or to percent