IBM 2008 Annual Report Download - page 34
Download and view the complete annual report
Please find page 34 of the 2008 IBM annual report below. You can navigate through the pages in the report by either clicking on the pages listed below, or by using the keyword search tool below to find specific information within the annual report.-
 1
1 -
2
-
3
-
4
-
5
-
6
-
7
-
8
-
9
-
10
-
11
-
12
-
13
-
14
-
15
-
16
-
17
-
18
-
19
-
20
-
21
-
22
-
23
-
 24
24 -
 25
25 -
 26
26 -
 27
27 -
 28
28 -
 29
29 -
 30
30 -
 31
31 -
 32
32 -
 33
33 -
 34
34 -
 35
35 -
 36
36 -
 37
37 -
 38
38 -
 39
39 -
 40
40 -
 41
41 -
 42
42 -
 43
43 -
 44
44 -
45
-
46
-
47
-
48
-
49
-
50
-
51
-
52
-
53
-
54
-
55
-
56
-
57
-
58
-
59
-
60
-
61
-
62
-
63
-
64
-
65
-
66
-
67
-
68
-
69
-
70
-
71
-
72
-
73
-
74
-
75
-
76
-
77
-
78
-
79
-
80
-
81
-
82
-
83
-
84
-
85
-
86
-
87
-
88
-
89
-
90
-
91
-
92
-
93
-
94
-
95
-
96
-
97
-
98
-
99
-
100
-
101
-
102
-
103
-
104
-
105
-
106
-
107
-
108
-
109
-
110
-
111
-
112
-
113
-
114
-
115
-
116
-
117
-
118
-
119
-
120
-
121
-
122
-
123
-
124
-
125
-
126
-
127
-
128
 |
 |

Management Discussion
INTERNATIONAL BUSINESS MACHINES CORPORATION and Subsidiary Companies
Management Discussion ................................................................................................18
ROAD MAP ............................................................................................................ 18
FORWARD-LOOKING AND CAUTIONARY STATEMENTS ...................................... 18
MANAGEMENT DISCUSSION SNAPSHOT ............................................................ 19
DESCRIPTION OF BUSINESS................................................................................20
YEAR IN REVIEW ..................................................................................................25
PRIOR YEAR IN REVIEW ....................................................................................... 39
DISCONTINUED OPERATIONS ..............................................................................44
OTHER INFORMATION ..........................................................................................44
GLOBAL FINANCING .............................................................................................53
Report Of Management ............................................................................................... 58
Report Of Independent Registered Public Accounting Firm ................................. 59
Consolidated Statements ............................................................................................ 60
Notes ............................................................................................................................... 66
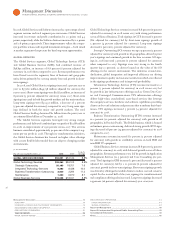
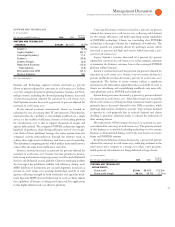
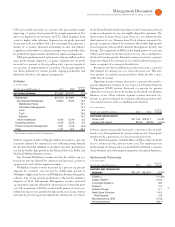
Interest Expense
($ )
Yr.-to-Yr.
For the year ended December : 2008 2007 Change
Interest expense
TOTAL $673 $611 10.3%
The increase in interest expense was primarily due to the increase in
debt in associated with the financing of the accelerated share
repurchase agreements, partially offset by lower interest rates in .
See note N, “Stockholders’ Equity,” on pages and for additional
information regarding the accelerated share repurchase. Interest
expense is presented in cost of financing in the Consolidated State-
ment of Earnings if the related external borrowings are to support
the Global Financing external business. See page for additional
information regarding Global Financing debt and interest expense.
Overall interest expense for was $, million, an increase of
$ million versus .
STOCK-BASED COMPENSATION
Total pre-tax stock-based compensation cost of $ million
decreased $ million compared to . The decrease was princi-
pally the result of a reduction in the level of stock option grants ($
million), offset by an increase related to restricted and performance-
based share units ($ million). The year-to-year change was
reflected in the following categories: reductions in cost ($ million)
and RD&E expense ($ million), and increases in SG&A expense ($
million) and other (income) and expense ($ million).
See note T, “Stock-Based Compensation,” on pages to for
additional information on the company’s stock-based incentive awards.
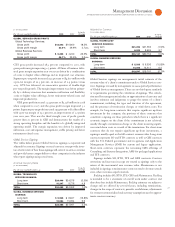
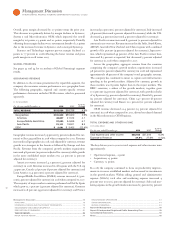
RETIREMENT-RELATED BENEFITS
The following table provides the total pre-tax cost for all retirement-
related plans. These amounts are included in the Consolidated
Statement of Earnings within the caption (e.g., cost, SG&A, RD&E)
relating to the job function of the plan participants.
($ )
Yr.-to-Yr.
For the year ended December : 2008 2007 Change
Defined benefit and contribution
pension plans cost $1,053 $2,198 (52.1)%
Nonpension postretirement plans costs 363 399 (9.0)
TOTAL $1,416 $2,597 (45.5)%
Overall, retirement-related plan costs decreased $, million ver-
sus primarily as a result of pension plan redesign efforts and a
lower level of recognized actuarial losses.
Effective January , , benefit accruals ceased in the IBM Per-
sonal Pension Plan, a U.S. defined benefit plan. This decrease was
partially offset by an increase in defined contribution plans, primarily
in the U.S. See note U, “Retirement-Related Benefits,” on pages
to for additional information on these plan changes and all the
factors driving the year-to-year change in total cost.
Retirement-related plan costs decreased approximately $ mil-
lion in cost, $ million in SG&A expense, $ million in RD&E
expense and $ million in other (income) and expense year to year.
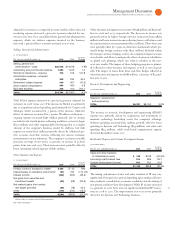
ACQUIRED INTANGIBLE ASSET AMORTIZATION
The company has been investing in targeted acquisitions to increase
its capabilities in higher value businesses. The following table pres-
ents the total acquired intangible asset amortization included in the
Consol idated Statement of Earnings. See note J, “Intangible Assets
Including Goodwill,” on pages and for additional information.
($ )
Yr.-to-Yr.
For the year ended December : 2008 2007* Change
Cost:
Software (Sales) $173 $ 91 89.2%
Global Technology Services (Services) 32 41 (21.0)
Global Business Services (Services) 0 1 (67.0)
Systems and Technology (Sales) 8 0 NM
Selling, general and
administrative expense 306 234 30.5
TOTAL $520 $367 41.5%
* Reclassified to conform with 2008 presentation disclosing the two services segments
separately.
NM—Not meaningful
INCOME TAXES
The effective tax rate for was . percent, compared with
. percent in . The . point decrease was primarily driven by
the net increase in the utilization of foreign and state tax credits
(. points), the benefit associated with the second quarter
agreement reached with the U.S. Internal Revenue Service (IRS)
regarding claims for certain tax incentives (. points) and the benefit
related to certain issues associated with newly published U.S. tax
regulations (. points). These benefits were partially offset by several