IBM 2008 Annual Report Download - page 33
Download and view the complete annual report
Please find page 33 of the 2008 IBM annual report below. You can navigate through the pages in the report by either clicking on the pages listed below, or by using the keyword search tool below to find specific information within the annual report.-
 1
1 -
2
-
3
-
4
-
5
-
6
-
7
-
8
-
9
-
10
-
11
-
12
-
13
-
14
-
15
-
16
-
17
-
18
-
19
-
20
-
21
-
22
-
 23
23 -
 24
24 -
 25
25 -
 26
26 -
 27
27 -
 28
28 -
 29
29 -
 30
30 -
 31
31 -
 32
32 -
 33
33 -
 34
34 -
 35
35 -
 36
36 -
 37
37 -
 38
38 -
 39
39 -
 40
40 -
 41
41 -
 42
42 -
 43
43 -
44
-
45
-
46
-
47
-
48
-
49
-
50
-
51
-
52
-
53
-
54
-
55
-
56
-
57
-
58
-
59
-
60
-
61
-
62
-
63
-
64
-
65
-
66
-
67
-
68
-
69
-
70
-
71
-
72
-
73
-
74
-
75
-
76
-
77
-
78
-
79
-
80
-
81
-
82
-
83
-
84
-
85
-
86
-
87
-
88
-
89
-
90
-
91
-
92
-
93
-
94
-
95
-
96
-
97
-
98
-
99
-
100
-
101
-
102
-
103
-
104
-
105
-
106
-
107
-
108
-
109
-
110
-
111
-
112
-
113
-
114
-
115
-
116
-
117
-
118
-
119
-
120
-
121
-
122
-
123
-
124
-
125
-
126
-
127
-
128
 |
 |

Management Discussion
INTERNATIONAL BUSINESS MACHINES CORPORATION and Subsidiary Companies
•
•
•
adjusted for currency), as compared to major markets where sales and
marketing expense increased percent ( percent adjusted for cur-
rency) year to year. On a consolidated basis, general and administrative
expenses, which are indirect expenses incurred in the business,
increased percent (flat at constant currency) year to year.
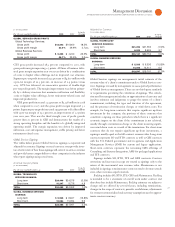
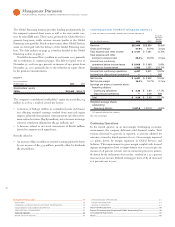
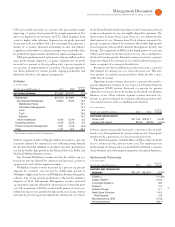
Selling, General and Administrative
($ )
Yr.-to-Yr.
For the year ended December : 2008 2007 Change
Selling, general and
administrative — base $20,006 $19,078 4.9%
Advertising and promotional expense 1,259 1,242 1.4
Workforce reductions — ongoing 706 318 121.8
Amortization expense —acquired
intangibles 306 234 30.5
Retirement-related expense 319 607 (47.3)
Stock-based compensation 484 480 0.8
Bad debt expense 306 100 205.1
TOTAL $23,386 $22,060 6.0%
Total SG&A expense increased . percent ( percent adjusted for
currency) in versus . The increase in SG&A was primarily
due to acquisition-related spending, predominantly for Cognos and
Telelogic, which accounted for points of the increase, while the
effects of currency accounted for points. Workforce reductions —
ongoing expense increased $ million primarily due to charges
recorded in the fourth quarter reflecting workforce actions in Japan
($ million) and other ongoing skills rebalancing that is a regular
element of the company’s business model. In addition, bad debt
expense increased $ million primarily driven by additional spe-
cific accounts receivable reserves reflecting the current economic
environment in many industries. The company’s accounts receivable
provision coverage at year end is . percent, an increase of basis
points from year-end . These increases were partially offset by
lower retirement-related expense of $ million.
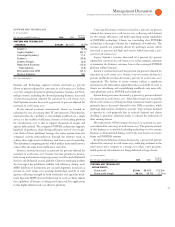
Other (Income) and Expense
($ )
Yr.-to-Yr.
For the year ended December : 2008 2007 Change
Foreign currency transaction losses* $ 330 $ 45 NM
(Gains)/losses on derivative instruments* (27) 194 (114.1)%
Interest income (343) (565) (39.3)
Net gains from securities and
investment assets (52) (68) (22.6)
Net realized gains from certain
real estate activities (26) (18) 45.0
Other (179) (214) (16.5)
TOTAL $(298) $(626) (52.4)%
* Reclassified to conform with 2008 presentation.
NM—Not meaningful
Other (income) and expense was income of $ million and $ mil-
lion in and , respectively. The decrease in income was
primarily driven by higher foreign currency transaction losses ($
million) and lower interest income reflecting lower cash balances and
the current interest rate environment ($ million). These decreases
were partially offset by a gain on derivative instruments which pri-
marily hedge foreign currency risks ($ million). Included within
the foreign currency hedging activity, the company hedges its major
cross-border cash flows to mitigate the effect of currency volatility in
its global cash planning, which also reduces volatility in the year-
over-year results. The impact of these hedging programs is primar-
ily reflected in other (income) and expense, as well as cost of goods
sold. The impact of losses from these cash flow hedges reflected in
other (income) and expense was $ million, a decrease of $ mil-
lion year to year.
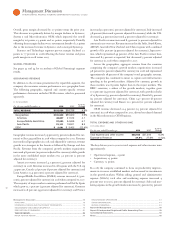
Research, Development and Engineering
($ )
Yr.-to-Yr.
For the year ended December : 2008 2007 Change
Research, development
and engineering
TOTAL $6,337 $6,153 3.0%
The increase in research, development and engineering (RD&E)
expense was primarily driven by acquisitions and investments to
maintain technology leadership across the company’s offerings.
Software spending increased $ million, partially offset by lower
spending in Systems and Technology ($ million) and other unit
spending ($ million), while stock-based compensation expense
decreased $ million versus .
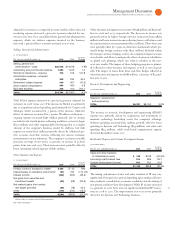
Intellectual Property and Custom Development Income
($ )
Yr.-to-Yr.
For the year ended December : 2008 2007 Change
Sales and other transfers
of intellectual property $ 138 $138 (00.0)%
Licensing/royalty-based fees 514 368 39.7
Custom development income 501 452 10.9
TOTAL $1,153 $958 20.4%
The timing and amount of sales and other transfers of IP may vary
significantly from period to period depending upon timing of divesti-
tures, industry consolidation, economic conditions and the timing of
new patents and know-how development. While IP income increased
. percent in , there were no significant individual IP transac-
tions in or . The improvement year to year was primarily
driven by the Systems and Technology business.