IBM 2008 Annual Report Download - page 125
Download and view the complete annual report
Please find page 125 of the 2008 IBM annual report below. You can navigate through the pages in the report by either clicking on the pages listed below, or by using the keyword search tool below to find specific information within the annual report.-
 1
1 -
2
-
3
-
4
-
5
-
6
-
7
-
8
-
9
-
10
-
11
-
12
-
13
-
14
-
15
-
16
-
17
-
18
-
19
-
20
-
21
-
22
-
23
-
24
-
25
-
26
-
27
-
28
-
29
-
30
-
31
-
32
-
33
-
34
-
35
-
36
-
37
-
38
-
39
-
40
-
41
-
42
-
43
-
44
-
45
-
46
-
47
-
48
-
49
-
50
-
51
-
52
-
53
-
54
-
55
-
56
-
57
-
58
-
59
-
60
-
61
-
62
-
63
-
64
-
65
-
66
-
67
-
68
-
69
-
70
-
71
-
72
-
73
-
74
-
75
-
76
-
77
-
78
-
79
-
80
-
81
-
82
-
83
-
84
-
85
-
86
-
87
-
88
-
89
-
90
-
91
-
92
-
93
-
94
-
95
-
96
-
97
-
98
-
99
-
100
-
101
-
102
-
103
-
104
-
105
-
106
-
107
-
108
-
109
-
110
-
111
-
112
-
113
-
114
-
 115
115 -
 116
116 -
 117
117 -
 118
118 -
 119
119 -
 120
120 -
 121
121 -
 122
122 -
 123
123 -
 124
124 -
 125
125 -
 126
126 -
 127
127 -
 128
128
 |
 |
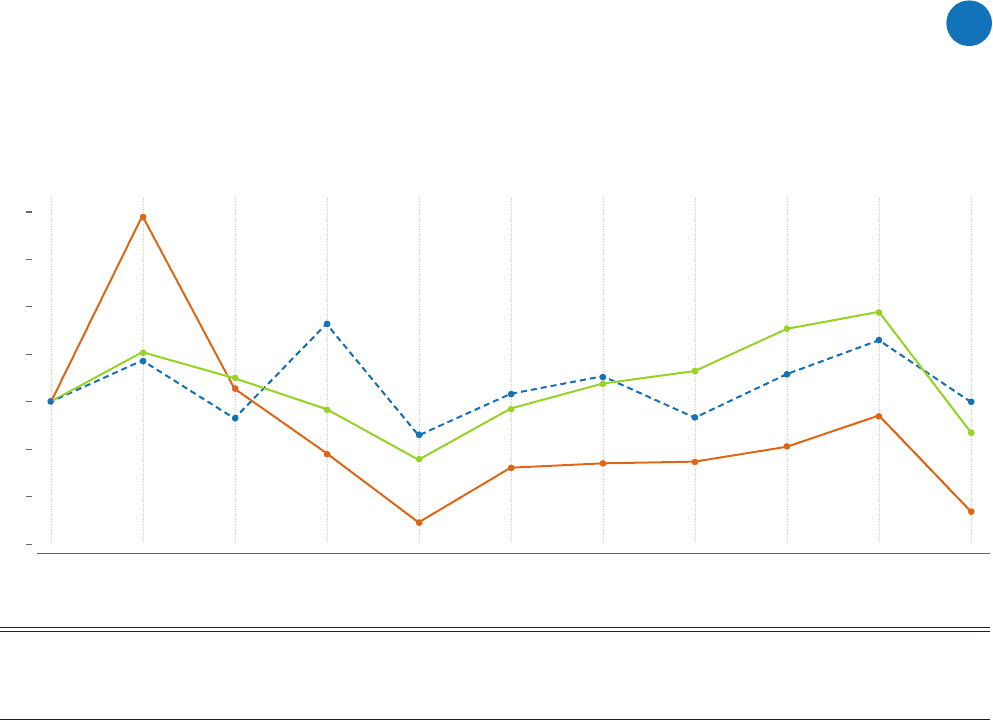
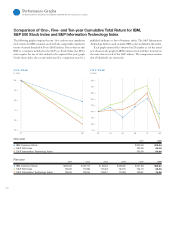
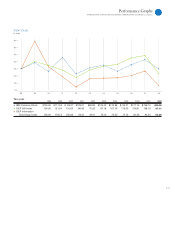
Performance Graphs
INTERNATIONAL BUSINESS MACHINES CORPORATION and Subsidiary Companies
Ten-year 1998 1999 2000 2001 2002 2003 2004 2005 2006 2007 2008
• IBM Common Stock $100.00 $117.50 $ 93.01 $133.01 $85.83 $103.42 $110.86 $ 93.31 $111.75 $126.10 $99.92
• S & P 500 Index 100.00 121.04 110.02 96.95 75.52 97.18 107.76 113.05 130.91 138.10 87.01
• S & P Information
Technology Index 100.00 178.74 105.63 78.31 49.01 72.16 74.00 74.73 81.03 94.24 53.58
ten-year
($ usd)
0898 99 00 01 02 03 04 05 06 07
180
160
140
120
80
100
60
40