IBM 2008 Annual Report Download - page 114
Download and view the complete annual report
Please find page 114 of the 2008 IBM annual report below. You can navigate through the pages in the report by either clicking on the pages listed below, or by using the keyword search tool below to find specific information within the annual report.-
 1
1 -
2
-
3
-
4
-
5
-
6
-
7
-
8
-
9
-
10
-
11
-
12
-
13
-
14
-
15
-
16
-
17
-
18
-
19
-
20
-
21
-
22
-
23
-
24
-
25
-
26
-
27
-
28
-
29
-
30
-
31
-
32
-
33
-
34
-
35
-
36
-
37
-
38
-
39
-
40
-
41
-
42
-
43
-
44
-
45
-
46
-
47
-
48
-
49
-
50
-
51
-
52
-
53
-
54
-
55
-
56
-
57
-
58
-
59
-
60
-
61
-
62
-
63
-
64
-
65
-
66
-
67
-
68
-
69
-
70
-
71
-
72
-
73
-
74
-
75
-
76
-
77
-
78
-
79
-
80
-
81
-
82
-
83
-
84
-
85
-
86
-
87
-
88
-
89
-
90
-
91
-
92
-
93
-
94
-
95
-
96
-
97
-
98
-
99
-
100
-
101
-
102
-
103
-
 104
104 -
 105
105 -
 106
106 -
 107
107 -
 108
108 -
 109
109 -
 110
110 -
 111
111 -
 112
112 -
 113
113 -
 114
114 -
 115
115 -
 116
116 -
 117
117 -
 118
118 -
 119
119 -
 120
120 -
 121
121 -
 122
122 -
 123
123 -
 124
124 -
125
-
126
-
127
-
128
 |
 |

Notes to Consolidated Financial Statements
INTERNATIONAL BUSINESS MACHINES CORPORATION and Subsidiary Companies
Management Discussion ............................................................................................. 18
Consolidated Statements ............................................................................................ 60
Notes ............................................................................................................................... 66
A – E ........................................................................................................................66
F – J ........................................................................................................................86
K– Q .......................................................................................................................88
R –W ..................................................................................................................... 102
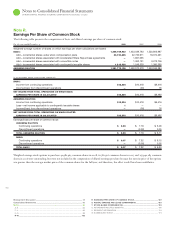
R. EARNINGS PER SHARE OF COMMON STOCK .............................................. 102
S. RENTAL EXPENSE AND LEASE COMMITMENTS ........................................... 10 3
T. STOCK-BASED COMPENSATION ................................................................... 103
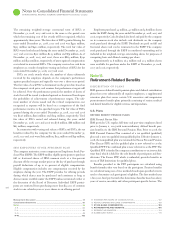
U. RETIREMENT-RELATED BENEFITS ............................................................... 106
V. SEGMENT INFORMATION .............................................................................. 116
W. SUBSEQUENT EVENT .................................................................................... 119
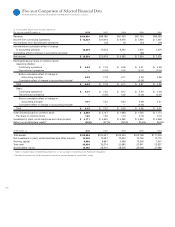
Defined Benefit Pension Plans
U.S. Plans Non-U.S. Plans
For the year ended December : 2008 2007 2006 2008 2007 2006
WEIGHTED-AVERAGE ASSUMPTIONS USED TO MEASURE NET
PERIODIC (INCOME)/COST FOR THE YEAR ENDED DECEMBER 31:
Discount rate 6.00% 5.75% 5.50% 5.06% 4.40% 4.19%
Expected long-term returns on plan assets 8.00% 8.00% 8.00% 6.86% 6.95% 7.14%
Rate of compensation increase* N/A 4.00% 4.00% 3.23% 3.05% 3.11%
WEIGHTED-AVERAGE ASSUMPTIONS USED TO MEASURE
BENEFIT OBLIGATIONS AT DECEMBER 31:
Discount rate 5.75% 6.00% 5.75% 4.89% 5.06% 4.40%
Rate of compensation increase* N/A N/A 4.00% 3.09% 3.23% 3.05%
* Rate of compensation increase is not applicable to the U.S. defined benefit pension plans as benefit accruals ceased December 31, 2007 for all participants.
N/A—Not applicable
Nonpension Postretirement Benefit Plans
U.S. Plan Non-U.S. Plans
For the year ended December : 2008 2007 2006 2008 2007 2006
WEIGHTED-AVERAGE ASSUMPTIONS USED TO MEASURE NET
PERIODIC COST FOR THE YEAR ENDED DECEMBER 31:
Discount rate 6.00% 5.75% 5.50% 7.13% 6.93% 6.58%
Expected long-term returns on plan assets 3.02% N/A N/A 9.04% 9.95% 11.50%
WEIGHTED-AVERAGE ASSUMPTIONS USED TO MEASURE
BENEFIT OBLIGATIONS AT DECEMBER 31:
Discount rate 5.75% 6.00% 5.75% 7.36% 7.13% 6.93%
N/A—Not applicable
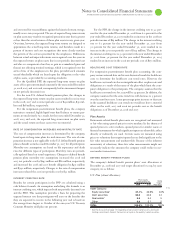
DISCOUNT RATE
The discount rate assumptions used for the retirement-related benefit
plans accounting reflect the yields available on high-quality, fixed
income debt instruments at the measurement date. For the U.S. dis-
count rate assumptions, a portfolio of high-quality corporate bonds
is constructed with maturities that match the expected timing of the
benefit obligation payments. In the non-U.S., where markets for
high-quality long-term bonds are not generally as well developed, a
portfolio of long-term government bonds is used as a base, to which
a credit spread is added to simulate corporate bond yields at these
maturities in the jurisdiction of each plan, as the benchmark for
developing the respective discount rates. The value of the portfolios
constructed in developing the discount rate assumptions is sufficient
to effectively settle the benefit obligations and excludes any bonds
that do not represent high-quality corporate bonds as a result of cur-
rent market fluctuations.
For the U.S. defined benefit pension plans, the changes in discount
rate assumptions impacted the net periodic (income)/cost and the
PBO. The changes in discount rate assumptions resulted in an increase
in the net periodic income of $ million, a decrease in the
net periodic cost of $ million and an increase in the net
periodic cost of $ million. The changes in discount rate assumptions
resulted in an increase in the PBO of $, million and a decrease
of $, million at December , and , respectively.
For the non-U.S. defined benefit pension plans, the changes in
discount rate assumptions resulted in a decrease in the net
periodic cost of $ million and an increase in the and net
periodic cost of $ million and $ million, respectively.
For the nonpension postretirement benefit plans, the changes in
discount rate assumptions had no material impact on net periodic
cost for the years ended December , , and and on
the APBO at December , and .
EXPECTED LONG-TERM RETURNS ON PLAN ASSETS
Expected returns on plan assets, a component of net periodic
(income)/cost, represent the expected long-term returns on plan
assets based on the calculated market-related value of plan assets.
The market-related value of plan assets recognizes changes in the fair
value of plan assets systematically over a five-year period. Expected
long-term returns on plan assets take into account long-term expecta-
tions for future returns and investment strategy. These rates of return
are developed by the company, calculated using an arithmetic average