IBM 2008 Annual Report Download - page 107
Download and view the complete annual report
Please find page 107 of the 2008 IBM annual report below. You can navigate through the pages in the report by either clicking on the pages listed below, or by using the keyword search tool below to find specific information within the annual report.-
 1
1 -
2
-
3
-
4
-
5
-
6
-
7
-
8
-
9
-
10
-
11
-
12
-
13
-
14
-
15
-
16
-
17
-
18
-
19
-
20
-
21
-
22
-
23
-
24
-
25
-
26
-
27
-
28
-
29
-
30
-
31
-
32
-
33
-
34
-
35
-
36
-
37
-
38
-
39
-
40
-
41
-
42
-
43
-
44
-
45
-
46
-
47
-
48
-
49
-
50
-
51
-
52
-
53
-
54
-
55
-
56
-
57
-
58
-
59
-
60
-
61
-
62
-
63
-
64
-
65
-
66
-
67
-
68
-
69
-
70
-
71
-
72
-
73
-
74
-
75
-
76
-
77
-
78
-
79
-
80
-
81
-
82
-
83
-
84
-
85
-
86
-
87
-
88
-
89
-
90
-
91
-
92
-
93
-
94
-
95
-
96
-
 97
97 -
 98
98 -
 99
99 -
 100
100 -
 101
101 -
 102
102 -
 103
103 -
 104
104 -
 105
105 -
 106
106 -
 107
107 -
 108
108 -
 109
109 -
 110
110 -
 111
111 -
 112
112 -
 113
113 -
 114
114 -
 115
115 -
 116
116 -
 117
117 -
118
-
119
-
120
-
121
-
122
-
123
-
124
-
125
-
126
-
127
-
128
 |
 |

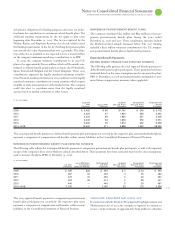
Notes to Consolidated Financial Statements
INTERNATIONAL BUSINESS MACHINES CORPORATION and Subsidiary Companies
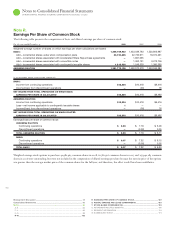
During the year ended December , , the company did not grant any stock options with exercise prices greater than the stock price at the
date of grant. During the year ended December , , the company granted approximately . million stock options with exercise prices greater
than the stock price at the date of grant with weighted-average exercise prices of $, which are included in the table on the bottom of page .
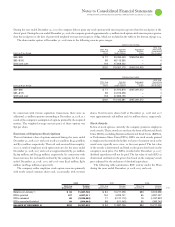
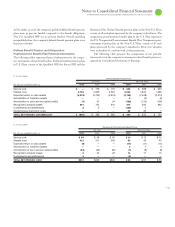
The shares under option at December , were in the following exercise price ranges:
Options Outstanding
Wtd. Avg.
Wtd. Avg. Number Aggregate Remaining
Exercise of Shares Intrinsic Contractual
Exercise Price Range Price Under Option Value Life (in years)
$60 – $85 $ 77 23,335,453 $169,255,650 4
$85 – $105 98 48,113,395 —4
$105 and over 118 47,858,322 —2
$102 119,307,170 $169,255,650 3
Options Exercisable
Wtd. Avg.
Wtd. Avg. Number Aggregate Remaining
Exercise of Shares Intrinsic Contractual
Exercise Price Range Price Under Option Value Life (in years)
$60 – $85 $ 77 21,972,870 $167,281,212 4
$85 – $105 98 44,616,356 —4
$105 and over 118 47,856,155 —2
$102 114,445,381 $167,281,212 3
In connection with various acquisition transactions, there were an
additional . million options outstanding at December , , as a
result of the company’s assumption of options granted by the acquired
entities. The weighted-average exercise price of these options was
$ per share.
Exercises of Employee Stock Options
The total intrinsic value of options exercised during the years ended
December , , and was $, million, $, million
and $ million, respectively. The total cash received from employ-
ees as a result of employee stock option exercises for the years ended
December , , and was approximately $, million,
$, million and $, million, respectively. In connection with
these exercises, the tax benefits realized by the company for the years
ended December , , and were $ million, $
million and $ million, respectively.
The company settles employee stock option exercises primarily
with newly issued common shares and, occasionally, with treasury
shares. Total treasury shares held at December , and
were approximately million and million shares, respectively.
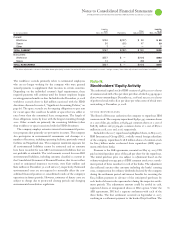
Stock Awards
In lieu of stock options, currently the company grants its employees
stock awards. These awards are made in the form of Restricted Stock
Units (RSUs), including Retention Restricted Stock Units (RRSUs),
or Performance Share Units (PSUs). RSUs are stock awards granted
to employees that entitle the holder to shares of common stock as the
award vests, typically over a two- to five-year period. The fair value
of the awards is determined and fixed on the grant date based on the
company’s stock price. For RSUs awarded after December , ,
dividend equivalents will not be paid. The fair value of such RSUs is
determined and fixed on the grant date based on the company’s stock
price adjusted for the exclusion of dividend equivalents.
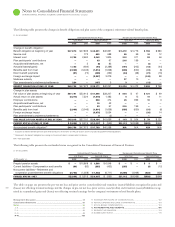
The following table summarizes RSU activity under the Plans
during the years ended December , , and .
2008 2007 2006
Wtd. Avg. Number Wtd. Avg. Number Wtd. Avg. Number
Grant Price of Units Grant Price of Units Grant Price of Units
Balance at January 1 $ 94 11,887,746 $ 84 10,217,258 $83 6,813,698
RSUs granted 107 4,587,011 104 4,929,141 85 4,831,227
RSUs released 88 (3,526,580) 77 (2,747,110) 76 (1,037,927)
RSUs canceled/forfeited 98 (550,662) 88 (511,543) 85 (389,740)
BALANCE AT DECEMBER 31 $100 12,397,515 $ 94 11,887,746 $84 10,217,258