IBM 2008 Annual Report Download - page 35
Download and view the complete annual report
Please find page 35 of the 2008 IBM annual report below. You can navigate through the pages in the report by either clicking on the pages listed below, or by using the keyword search tool below to find specific information within the annual report.-
 1
1 -
2
-
3
-
4
-
5
-
6
-
7
-
8
-
9
-
10
-
11
-
12
-
13
-
14
-
15
-
16
-
17
-
18
-
19
-
20
-
21
-
22
-
23
-
24
-
 25
25 -
 26
26 -
 27
27 -
 28
28 -
 29
29 -
 30
30 -
 31
31 -
 32
32 -
 33
33 -
 34
34 -
 35
35 -
 36
36 -
 37
37 -
 38
38 -
 39
39 -
 40
40 -
 41
41 -
 42
42 -
 43
43 -
 44
44 -
 45
45 -
46
-
47
-
48
-
49
-
50
-
51
-
52
-
53
-
54
-
55
-
56
-
57
-
58
-
59
-
60
-
61
-
62
-
63
-
64
-
65
-
66
-
67
-
68
-
69
-
70
-
71
-
72
-
73
-
74
-
75
-
76
-
77
-
78
-
79
-
80
-
81
-
82
-
83
-
84
-
85
-
86
-
87
-
88
-
89
-
90
-
91
-
92
-
93
-
94
-
95
-
96
-
97
-
98
-
99
-
100
-
101
-
102
-
103
-
104
-
105
-
106
-
107
-
108
-
109
-
110
-
111
-
112
-
113
-
114
-
115
-
116
-
117
-
118
-
119
-
120
-
121
-
122
-
123
-
124
-
125
-
126
-
127
-
128
 |
 |

Management Discussion
INTERNATIONAL BUSINESS MACHINES CORPORATION and Subsidiary Companies
items including the net impact related to the completion of the U.S.
federal income tax examination for the years 2004 and 2005 including
the associated income tax reserve redeterminations (0.5 points), the
second quarter 2008 tax cost associated with the intercompany transfer
of certain intellectual property (2.8 points) and lower capital loss
utilization in 2008 (0.7 points). The remaining items were individu-
ally insignificant.
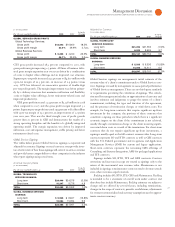
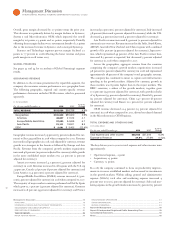
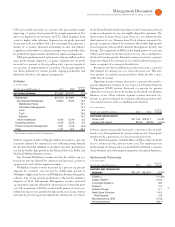
EARNINGS PER SHARE
Basic earnings per share is computed on the basis of the weighted-
average number of shares of common stock outstanding during the
period. Diluted earnings per share is computed on the basis of the
weighted-average number of shares of common stock plus the effect
of dilutive potential common shares outstanding during the period
using the treasury stock method. Dilutive potential common shares
include outstanding stock options, share awards, convertible notes
and shares which may be required to settle accelerated share repur-
chase (ASR) agreements.
Yr.-to-Yr.
For the year ended December : 2008 2007 Change
Earnings per share of common stock:
Assuming dilution:
Continuing operations $8.93 $ 7.18 24.4%
Discontinued operations — (0.00) NM
Total $8.93 $ 7.18 24.4%
Basic:
Continuing operations $9.07 $ 7.32 23.9%
Discontinued operations — (0.00) NM
Total $9.07 $ 7.32 23.9%
Weighted-average shares
outstanding (in millions):
Assuming dilution 1,381.8 1,450.6 (4.7)%
Basic 1,359.8 1,423.0 (4.4)%
NM—Not meaningful
Actual shares outstanding at December 31, 2008 and December 31,
2007 were 1,339.1 million and 1,385.2 million, respectively. The aver-
age number of common shares outstanding assuming dilution was
68.8 million shares lower in 2008 versus 2007. The decrease was
primarily the result of the company’s common stock repurchase pro-
gram. See note N, “Stockholders’ Equity Activity,” on pages 95 and
96 for additional information regarding common stock activities. Also
see note R, “Earnings Per Share of Common Stock,” on page 102.
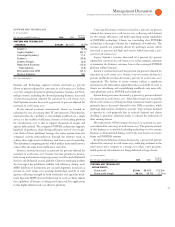
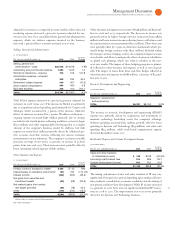
Financial Position
DYNAMICS
At December 31, 2008, the company’s balance sheet and liquidity
position remain strong. Cash on hand at year-end was $12,741 mil-
lion. Total debt of $33,926 million decreased $1,349 million from
prior year-end levels. The commercial paper balance at December 31
was $468 million, down $5,363 million from December 31, 2007. In
2008, the company generated $18,812 million in cash from operations,
an increase of $2,718 million compared to 2007. The company has
consistently generated strong cash flow from operations and contin-
ues to have access to additional sources of liquidity through the
capital markets and its $10 billion global credit facility.
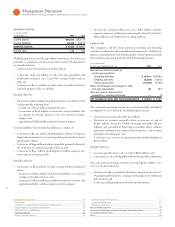
Consistent with retirement and postretirement plan accounting
standards, the company remeasures the funded status of its plans at
December 31. The funded status is measured as the difference
between the fair value of the plan assets and the benefit obligation
and is recognized in the Consolidated Statement of Financial
Position. At December 31, 2008, primarily as a result of the returns
on plan assets, coupled with changes in certain plan assumptions and
plan contributions, the overall net funded position decreased $21,793
million from December 31, 2007 to a net under-funded position of
$18,485 million. This change is primarily reflected in prepaid pen-
sion assets and retirement and nonpension postretirement benefit
obligations which decreased $15,816 million and increased $5,871
million respectively from year-end 2007 levels. Due to the extreme
volatility in the equity markets in 2008, the return on IBM Personal
Pension Plan assets declined 15 percent, compared to a 14 percent
increase in 2007. The company’s asset return in the non-U.S. plans
declined approximately 21 percent. Within the company’s defined
benefit plans, the net funded status declined in 2008 due to the vola-
tility in the financial markets. At December 31, 2008, the company’s
qualified defined benefit plans worldwide were 93 percent funded,
with the U.S. qualified Personal Pension Plan 97 percent funded.
In addition, stockholders’ equity decreased $15,004 million, net of
tax, primarily as a result of changes from pension remeasurements
and current
year activity within accumulated gains and (losses) not
affecting retained
earnings. This is a non-cash impact to equity and
does not affect the company’s access to capital markets or its ability
to meet its obligations.
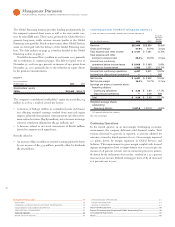
The assets and debt associated with the Global Financing business
are a significant part of the company’s financial position. The financial
position amounts appearing on pages 34 to 36 are the consolidated
amounts including Global Financing. The amounts appearing in the
separate Global Financing section on pages 53 through 57 are supple-
mentary data presented to facilitate an understanding of the Global
Financing business.