IBM 2008 Annual Report Download - page 7
Download and view the complete annual report
Please find page 7 of the 2008 IBM annual report below. You can navigate through the pages in the report by either clicking on the pages listed below, or by using the keyword search tool below to find specific information within the annual report.-
 1
1 -
 2
2 -
 3
3 -
 4
4 -
 5
5 -
 6
6 -
 7
7 -
 8
8 -
 9
9 -
 10
10 -
 11
11 -
 12
12 -
 13
13 -
 14
14 -
 15
15 -
 16
16 -
 17
17 -
 18
18 -
19
-
20
-
21
-
22
-
23
-
24
-
25
-
26
-
27
-
28
-
29
-
30
-
31
-
32
-
33
-
34
-
35
-
36
-
37
-
38
-
39
-
40
-
41
-
42
-
43
-
44
-
45
-
46
-
47
-
48
-
49
-
50
-
51
-
52
-
53
-
54
-
55
-
56
-
57
-
58
-
59
-
60
-
61
-
62
-
63
-
64
-
65
-
66
-
67
-
68
-
69
-
70
-
71
-
72
-
73
-
74
-
75
-
76
-
77
-
78
-
79
-
80
-
81
-
82
-
83
-
84
-
85
-
86
-
87
-
88
-
89
-
90
-
91
-
92
-
93
-
94
-
95
-
96
-
97
-
98
-
99
-
100
-
101
-
102
-
103
-
104
-
105
-
106
-
107
-
108
-
109
-
110
-
111
-
112
-
113
-
114
-
115
-
116
-
117
-
118
-
119
-
120
-
121
-
122
-
123
-
124
-
125
-
126
-
127
-
128
 |
 |

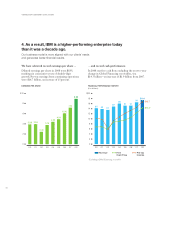
: Our revenue was
a record $103.6 billion, up 5 percent. In 2008
we grew pre-tax income from continuing
operations by 15 percent, to $16.7 billion,
the highest ever.
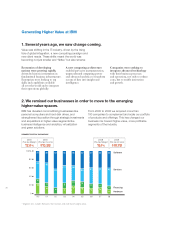
: IBM’s gross prot margin rose for
the fth consecutive year
—
to 44.1 percent,
up 7.6 points since 2003. Our pre-tax income
margin rose to 16.1 percent. Both margins are
at their highest in more than a decade. We
achieved this by driving productivity and
continuing to shift our business mix to more
protable segments. More than 90 percent of
our segment prot in 2008 was from software,
services and nancing.
: We have continued to
achieve strong EPS growth. Last year was
another record, with diluted earnings per share
from continuing operations of $8.93, up
24 percent. This marked six straight years of
double-digit EPS growth.
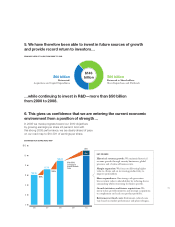
: IBM has consistently generated
strong cash ow. In 2008 our free cash
ow, excluding the year-to-year change in
Global Financing receivables, was $14.3 billion,
an increase of $1.9 billion from 2007. Our
business model has allowed us to generate more
than $84 billion in free cash ow over the past
nine years. IBM ended 2008 with $12.9 billion
of cash and marketable securities.
: Our superior cash ow
has enabled us to invest in the business and to
generate substantial returns to investors.
Our 2008 cash investment was $6.3 billion
for 15 acquisitions
—
10 of them in key areas
of software. And after investing $6.3 billion
in R&D and $4.5 billion in net capital
expenditures, we were able to return more
than $13 billion to you
—
$10.6 billion through
share repurchase and $2.6 billion through
dividends. Last year’s dividend increase was
25 percent, marking the 13th year in a row in
which we have raised our dividend.
In this environment, clients’ immediate
needs are very clear: to save money, preserve
capital and reduce costs. We help them do that,
and our ability to deliver that kind of value is
why they are continuing to choose IBM.
It’s why our services business achieved its
highest margin in the past ve years. It’s why
our software business continues to grow so
robustly
—
with pre-tax prot doubling over the
past ve years, to $7 billion in 2008. And it’s
why we continue to enjoy strength in high-
utilization, high-performance infrastructure.
Since the dot-com crash in 2002,
we have more than doubled
our pre-tax income and free cash
flow, and more than tripled our
earnings per share.