IBM 2008 Annual Report Download - page 13
Download and view the complete annual report
Please find page 13 of the 2008 IBM annual report below. You can navigate through the pages in the report by either clicking on the pages listed below, or by using the keyword search tool below to find specific information within the annual report.-
 1
1 -
2
-
 3
3 -
 4
4 -
 5
5 -
 6
6 -
 7
7 -
 8
8 -
 9
9 -
 10
10 -
 11
11 -
 12
12 -
 13
13 -
 14
14 -
 15
15 -
 16
16 -
 17
17 -
 18
18 -
 19
19 -
 20
20 -
 21
21 -
 22
22 -
 23
23 -
24
-
25
-
26
-
27
-
28
-
29
-
30
-
31
-
32
-
33
-
34
-
35
-
36
-
37
-
38
-
39
-
40
-
41
-
42
-
43
-
44
-
45
-
46
-
47
-
48
-
49
-
50
-
51
-
52
-
53
-
54
-
55
-
56
-
57
-
58
-
59
-
60
-
61
-
62
-
63
-
64
-
65
-
66
-
67
-
68
-
69
-
70
-
71
-
72
-
73
-
74
-
75
-
76
-
77
-
78
-
79
-
80
-
81
-
82
-
83
-
84
-
85
-
86
-
87
-
88
-
89
-
90
-
91
-
92
-
93
-
94
-
95
-
96
-
97
-
98
-
99
-
100
-
101
-
102
-
103
-
104
-
105
-
106
-
107
-
108
-
109
-
110
-
111
-
112
-
113
-
114
-
115
-
116
-
117
-
118
-
119
-
120
-
121
-
122
-
123
-
124
-
125
-
126
-
127
-
128
 |
 |

2
10
Revenue
7
9
Gross
Profit
1
13
Sales and
Marketing
Expense
0
General and
Administrative
Expense
12
9
6
3
0
15%
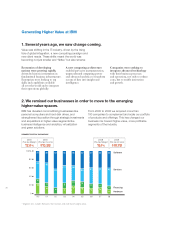
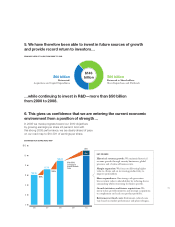
We are rebalancing our spending
to areas of greatest opportunity.
As we continue to drive signicant
productivity in Major Markets,
we are increasing investment in
Growth Markets, expanding our
go-to-market capabilities and skills
to capture the infrastructure
build-out in these regions. We are
leveraging our global reach and
integrated model to drive higher
protability across the company.
Major Markets
Growth Markets
Total IBM
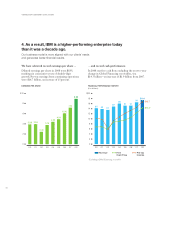
3. We became a globally integrated enterprise in order to capture the
best growth opportunities and improve IBM’s profitability.
IBM operates in more than 170 countries and enjoys
an increasingly broad-based geographic reach.
Our non-U.S. operations generated approximately
65 percent of IBM’s revenue in 2008. IBM’s Growth
Markets unit, which was established in 2008,
grew 10 percent last year, and made up 18 percent
of our revenues. Revenue increased 18 percent
(15 percent in local currency) in Brazil, Russia, India
and China.
2008 GROWTH
In local currency (excludes OEM)
Major Markets
Growth Markets
Major Markets Growth Markets
82% 18%
5% 10%
2% 10%
Percent of IBM
Geographic Revenue
Revenue Growth
Revenue Growth
in Local Currency
2008 PERFORMANCE